Bloomberg LP
ESG Portfolio Analysis Integration
MY ROLE
Lead Product Designer
SCOPE
Product Strategy
UX Research
MVP Design
Build support
TIMELINE
~3 months
Bloomberg LP is a financial software company providing data and other services to financial institutions and investors. The Portfolio Risk & Analytics product provides institutional portfolio managers transparency into their portfolio’s performance, characteristics, and risk so that they can make better decisions based on their portfolios’ goals.
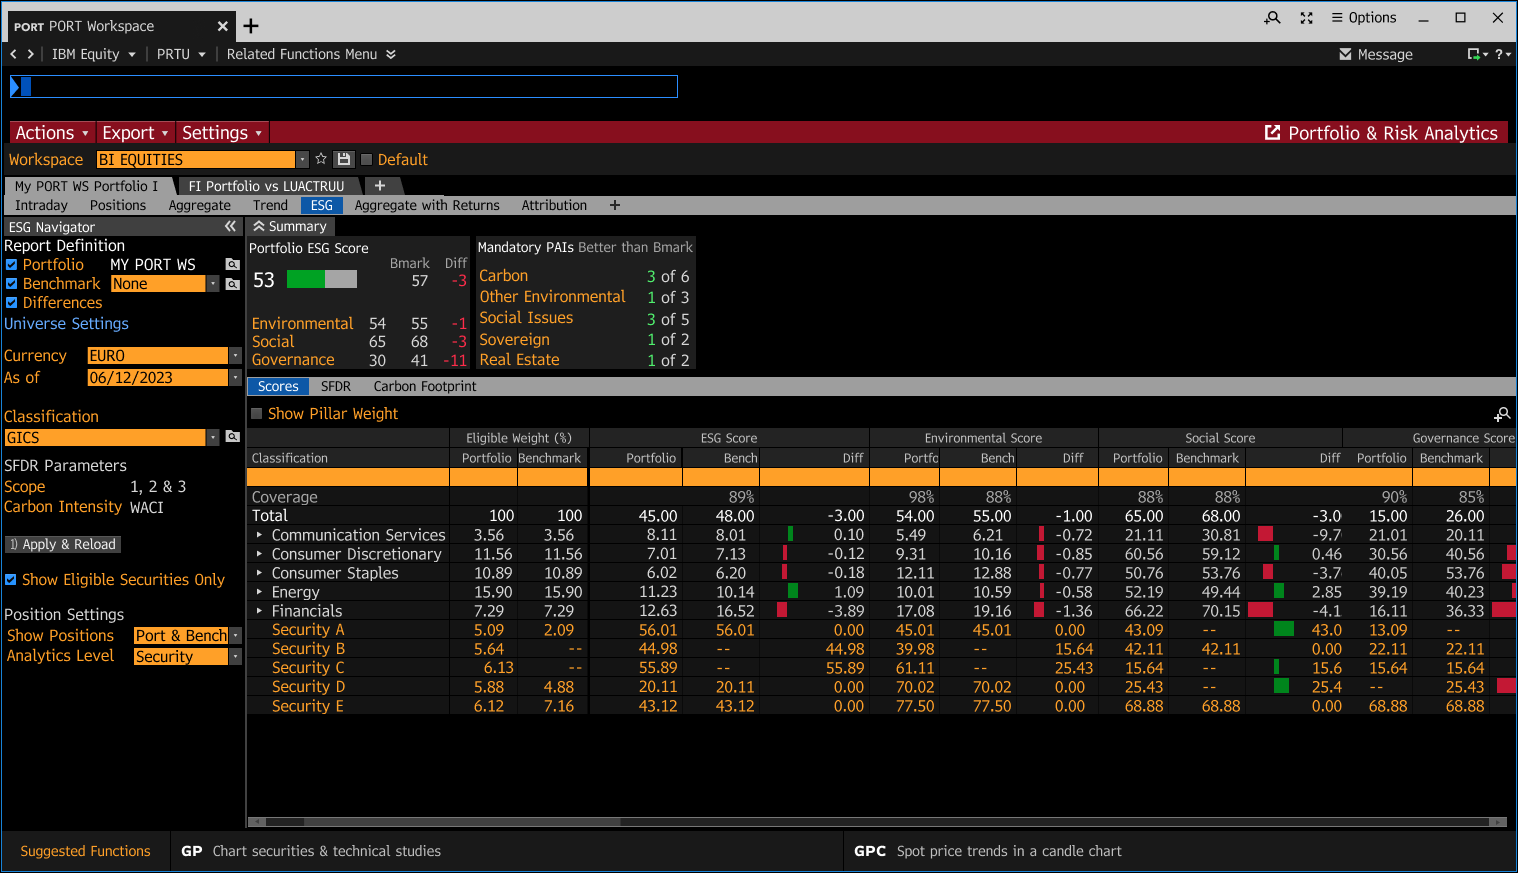
ESG analytics were integrated into Bloomberg PORT to help portfolio managers assess portfolio risk and performance through ESG data directly within their existing workflows.
OUTCOME
Strategic Impact
Product Impact
Delivered an MVP that integrated the most important ESG data into the PORT product, aligning with existing PORT interaction patterns to minimize onboarding friction.
Avoided a costly late-stage redesign by killing the high-density concept early, based on direct proxy-user testing rather than internal opinion.
Validated the core interaction model with real portfolio managers before full implementation, reducing the risk of building the wrong workflow.
Established a foundation and a validated set of unmet needs (e.g., complex workflows) for future ESG workflow iterations in PORT.
Improved stickiness of the terminal by incorporating Bloomberg ESG Scores in one of the most used portfolio management tools.
Influenced product direction of ESG scores by facilitating roadmap discussions and pushing the boundaries of the problem.
Team & Organizational Impact
Aligned two product teams, ESG and PORT, and an engineering lead around a shared MVP direction within a compressed timeline.
Mentored and onboarded a new designer by integrating her directly into a live, cross-functional project.
Business Context and Problem
Context
Bloomberg's ESG and Portfolio Risk & Analytics (PORT) teams identified an opportunity to bring ESG insights directly into portfolio analysis workflows. At the time, portfolio managers had no centralized way to assess ESG exposure, compare portfolios against benchmarks, or identify high/low-performing holdings. They relied on external tools disconnected from PORT — this fragmented workflow slowed decision-making and weakened Bloomberg's competitive position in the growing ESG analytics space.
I led design for the MVP and served as the liaison between the ESG and PORT product teams, translating requirements across both orgs and shaping the workflow direction through research and validation.
Problem
Portfolio managers lacked a centralized way to:
Assess portfolio ESG exposure
Compare portfolios against benchmarks
Identify high and low performing holdings
Analyze ESG risk directly within PORT, their main portfolio management operational tool
Goals and Strategy
The product goal was to increase discoverability of Bloomberg ESG Scores for PORT users, with the vision of becoming a competitive leading ESG provider to simplify users’ access to ESG insights.
My goal as a designer was to provide insightful and digestible ESG scores data to entice clients to use our product.
Case Study
MY ROLE & STRATEGIC CONTRIBUTION
The constraints that shaped my work
The project ran on a compressed 2-3 month timeline with a small, cross-functional team: one ESG Product Manager, one Engineering Lead, myself as Lead Designer, and a second designer I onboarded onto the team and brought in as hands-on support and training.
Two additional constraints shaped my work:
Requirements were still evolving as the ESG and PORT teams aligned on shared priorities for the first time.
The underlying ESG data structure significantly affected implementation complexity, which meant that workflow decisions had to be evaluated against engineering feasibility, not just usability, from day one.
Given the timeline and team size, we couldn't validate every direction exhaustively — every round of testing had to be deliberate and fast.
The MVP Workflow
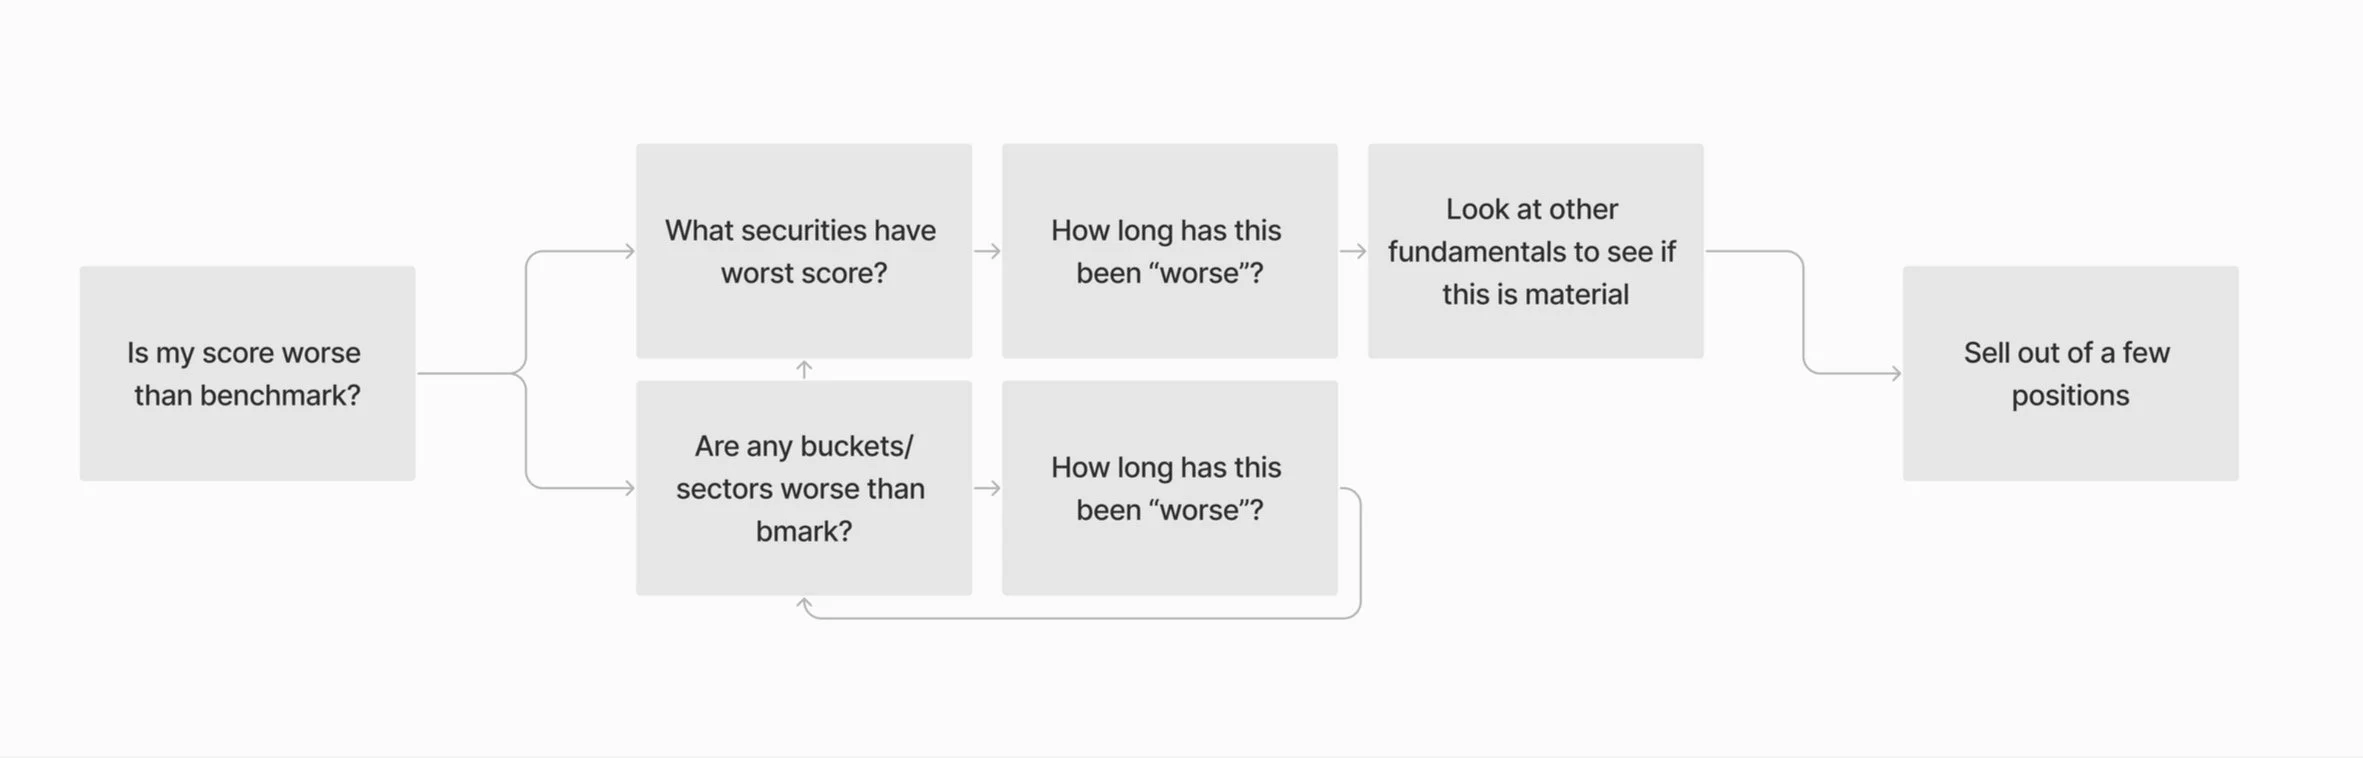
Early discovery revealed that portfolio managers primarily needed quick visibility into:
Portfolio ESG performance
Benchmark comparison
Strongest and weakest score holdings, in order to dive into security analysis and decide whether to hold/buy/sell the holding.
Primary Users
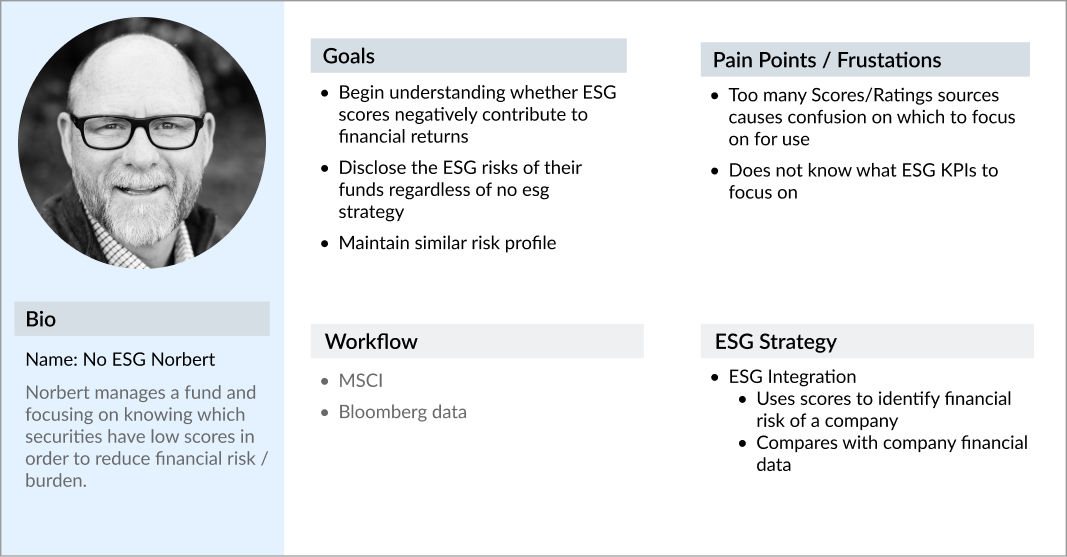
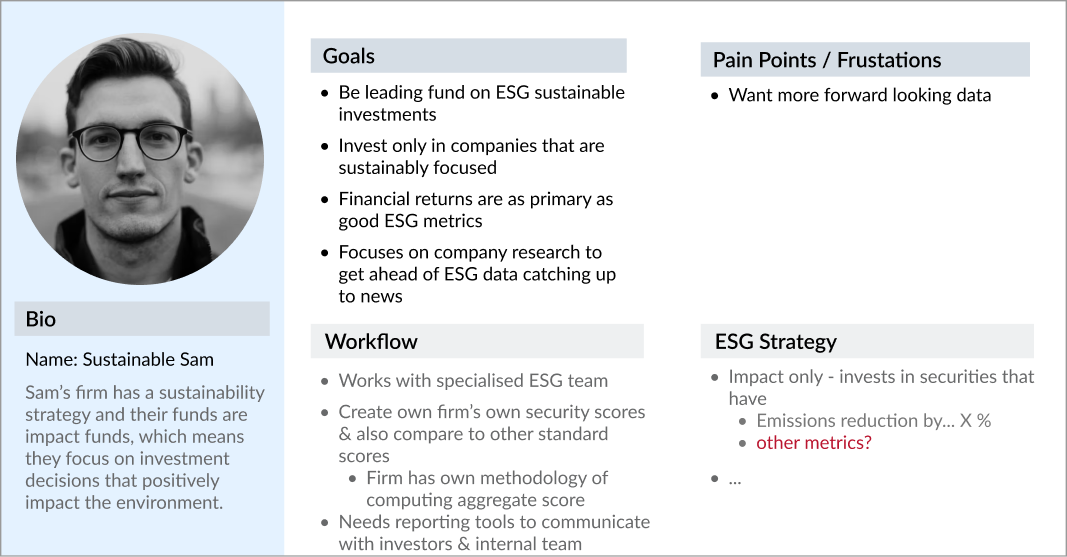
To reduce the option space quickly, I helped align the team around two primary user segments with lighter-to-moderate ESG reporting needs, deliberately excluding more advanced institutional workflows from MVP scope.
Narrowing to two user segments meant consciously deferring more complex data needs. This traded broader initial coverage for a scope the team could realistically validate and ship within the 2–3 month window.
This prioritization helped reduce scope complexity while still delivering an MVP with meaningful data.
Archetypes we were building for in the MVP timeline.
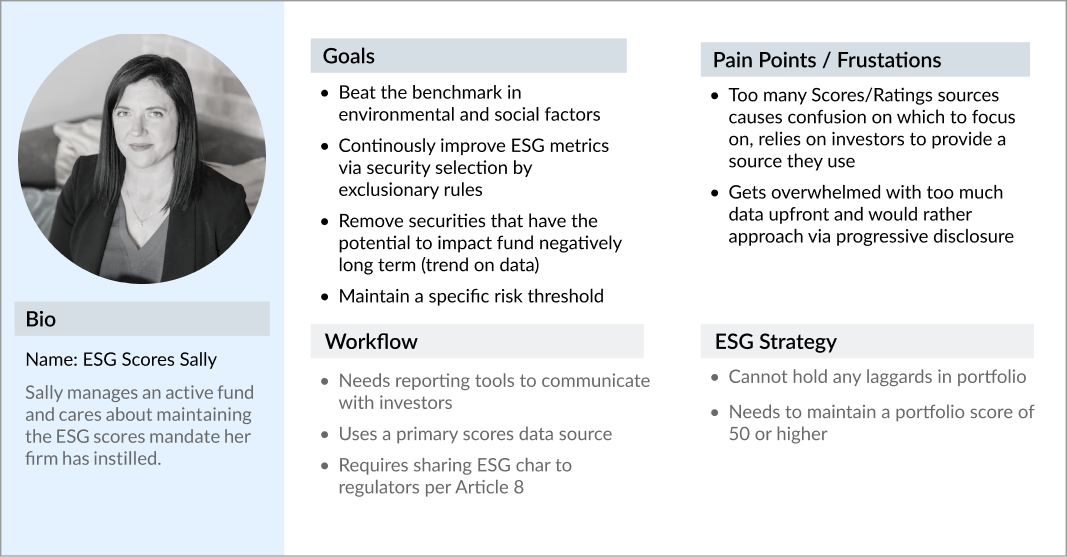
Archetype we were excluding, that required higher complexity workflows.
KEY PRODUCT & UX DECISIONS
Feedback, realigning MVP, and grid interaction model
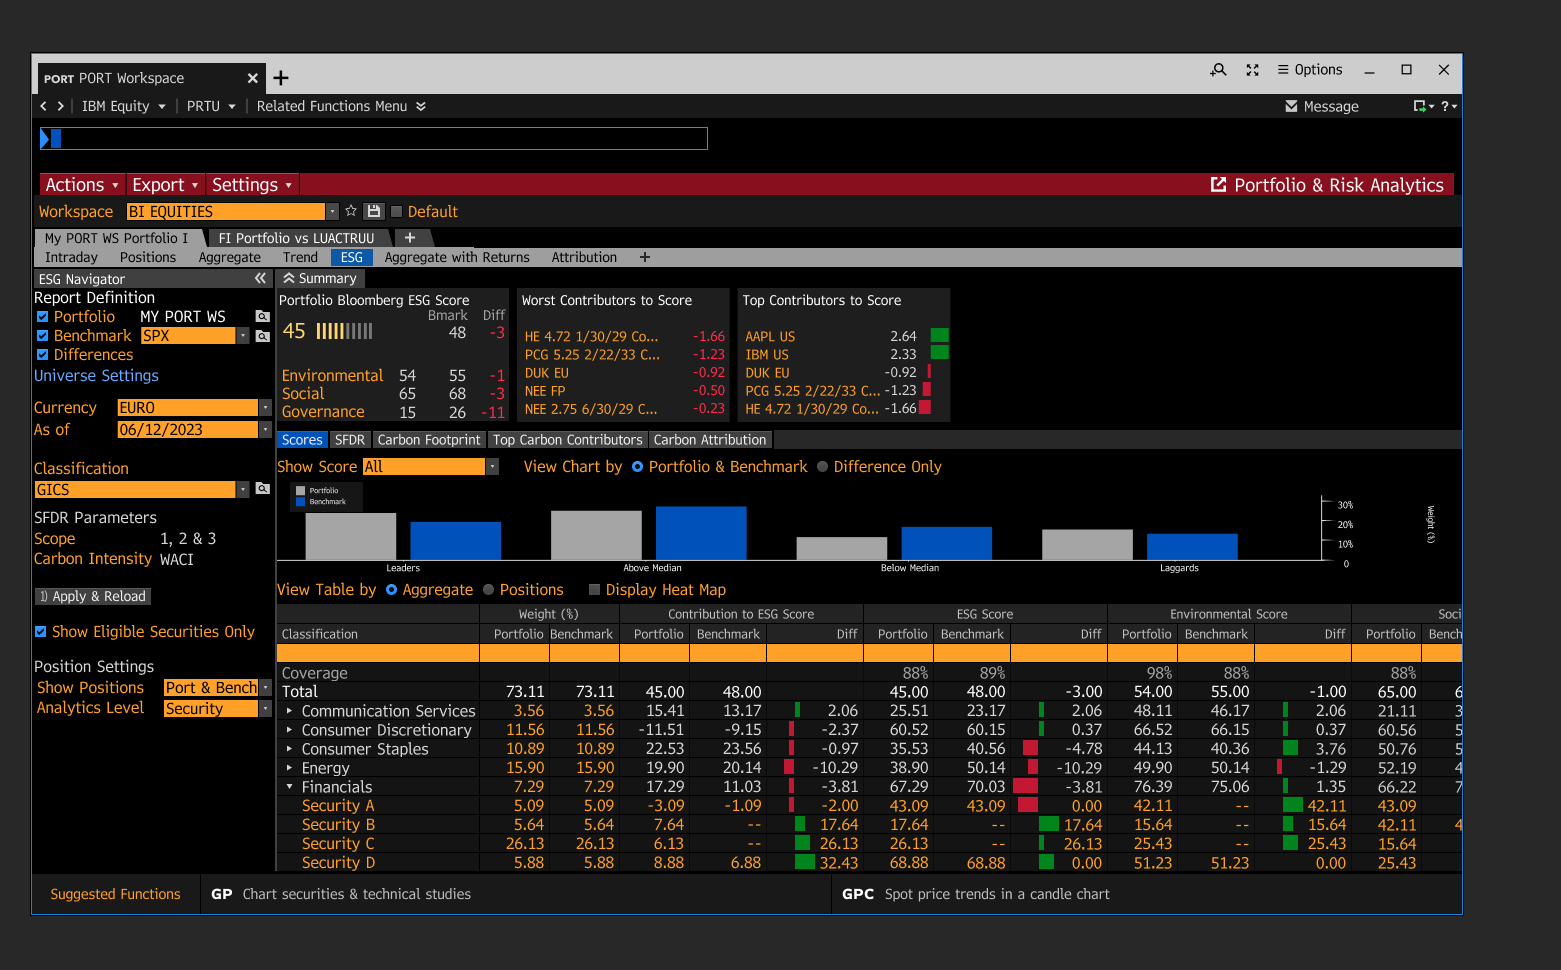
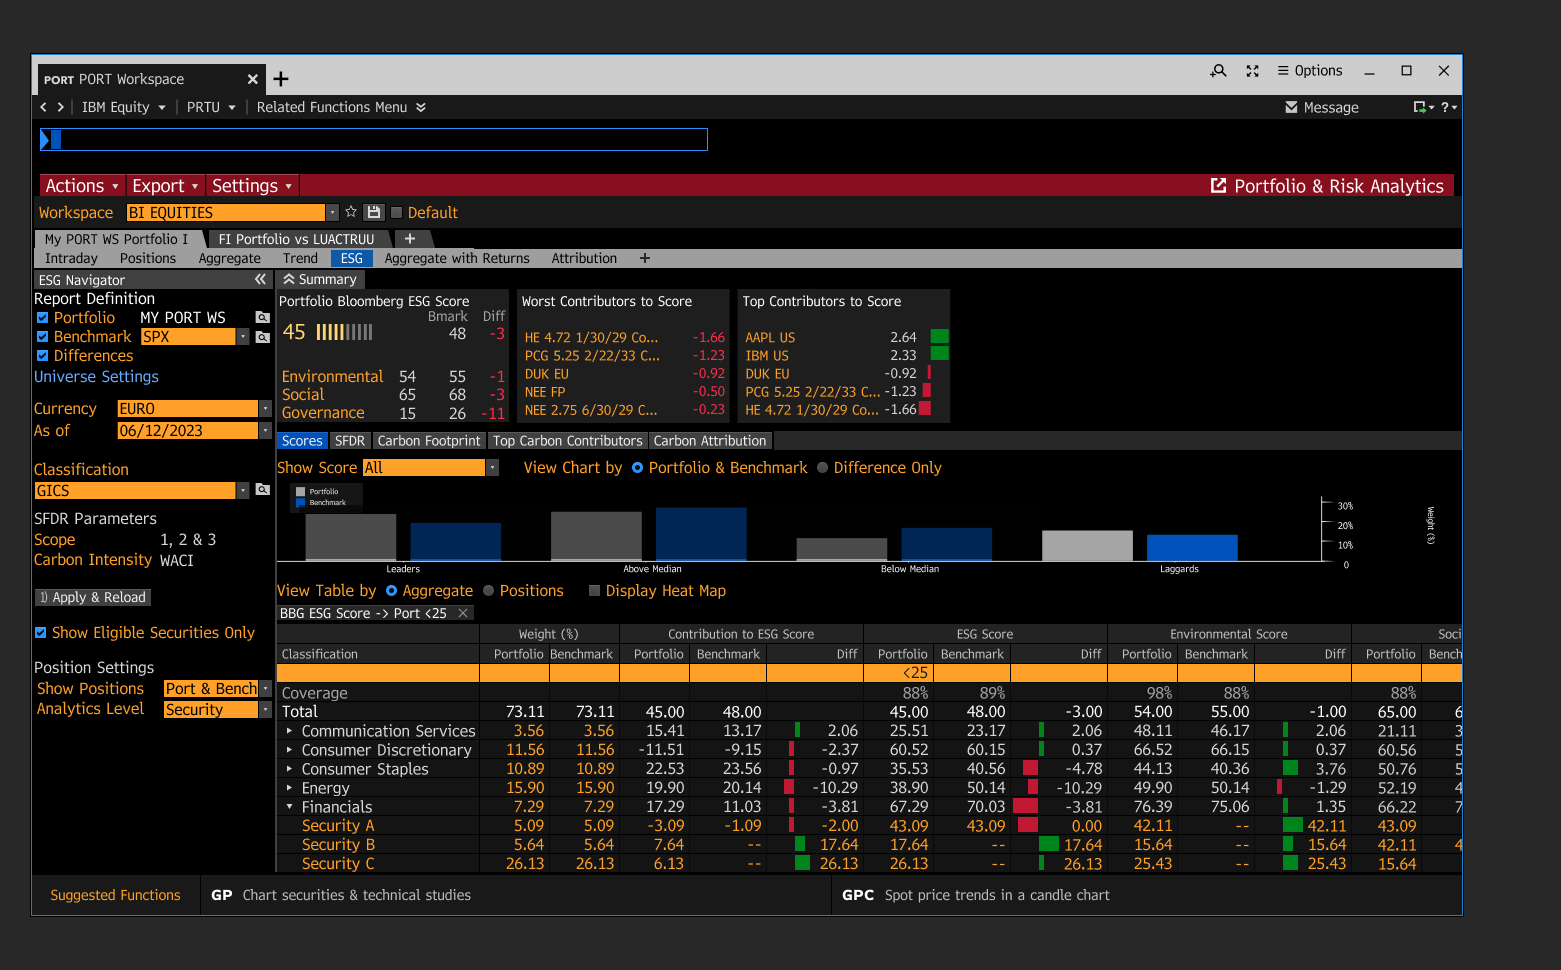
Two initial concepts, provided to me at the start of the project, were explored that leaned into rich data visualization as a means of surfacing ESG performance data.
A Histogram version showcased how a portfolio measured against its benchmark given a breakdown of ESG performance in the following categories: Leaders, Above Median, Below Median, Laggards.
2. A Heat map version showcased the ESG health via categories for users to prioritize where to start their analysis.
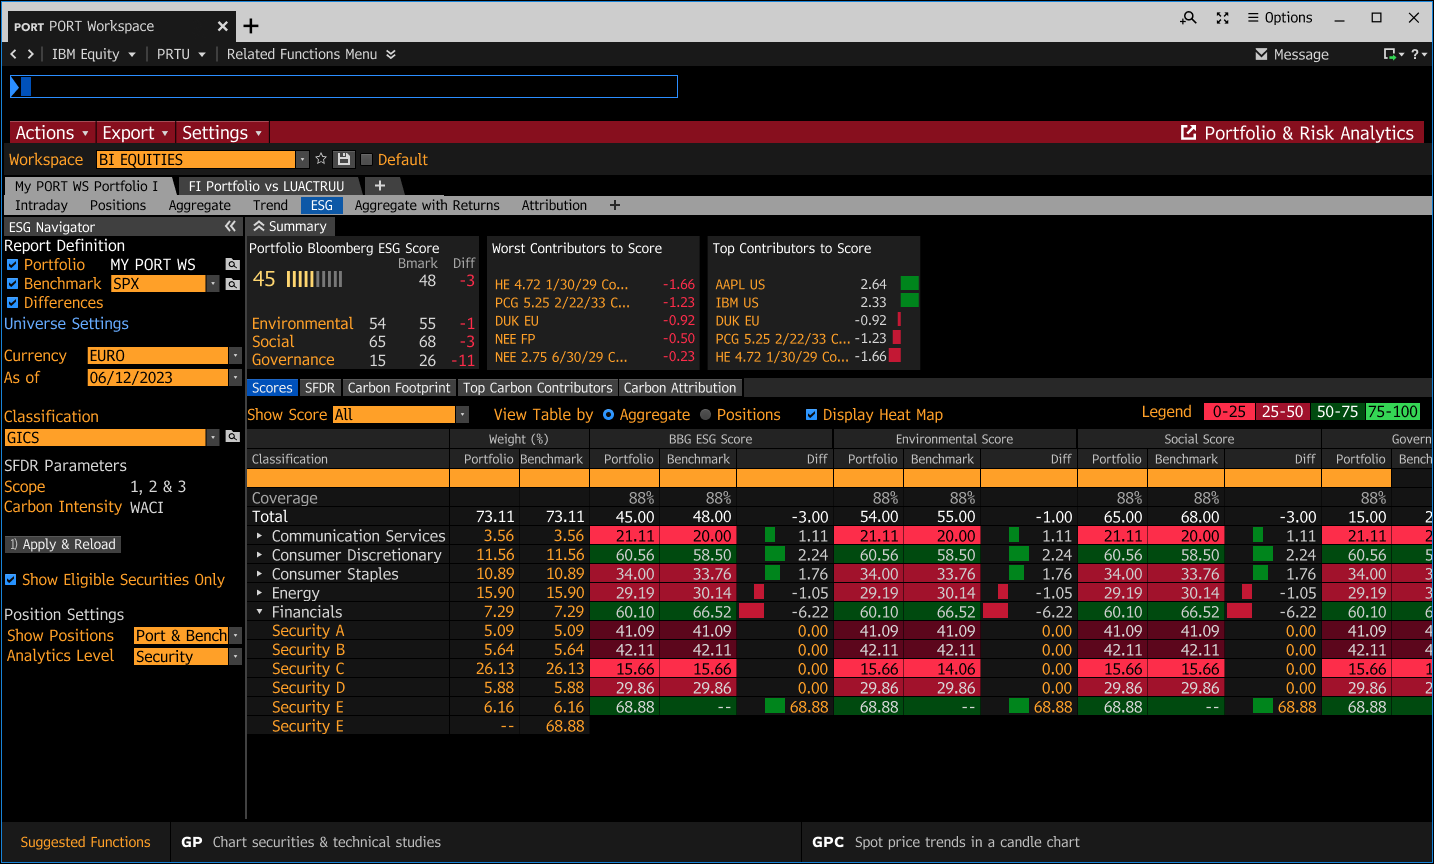
I tested these early concepts with 3 proxy users.
The results surfaced that
the density was adding cognitive load rather than aiding analysis, and
the categorical approach of segmenting ESG scores into four tiers does not necessarily align with how portfolio managers perceive and evaluate ESG.
→ Our conversations confirmed that because PM’s view their portfolio(s) based on portfolio strategy, their classification (e.g. grouping) might be unique for each portfolio, and they would want to view their ‘world’ in that way. ESG doesn’t change that.
After regrouping with the team, we pivoted to a clarity-first layout before investing further in high-fidelity design or engineering work. This helped us stay focused, prioritize, and set a roadmap for future development.
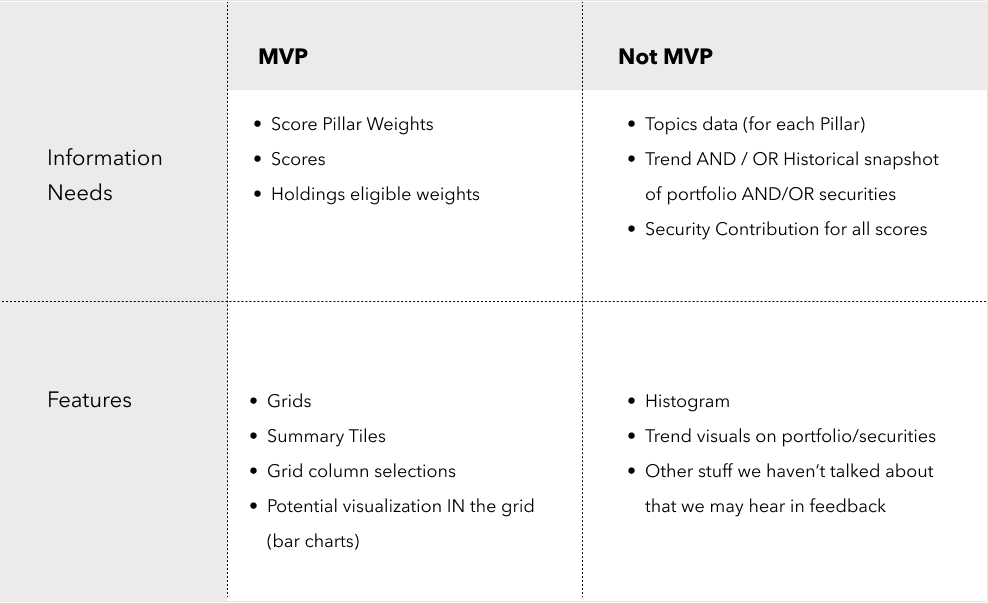
Visual shared with team
Exploring the grid interaction model
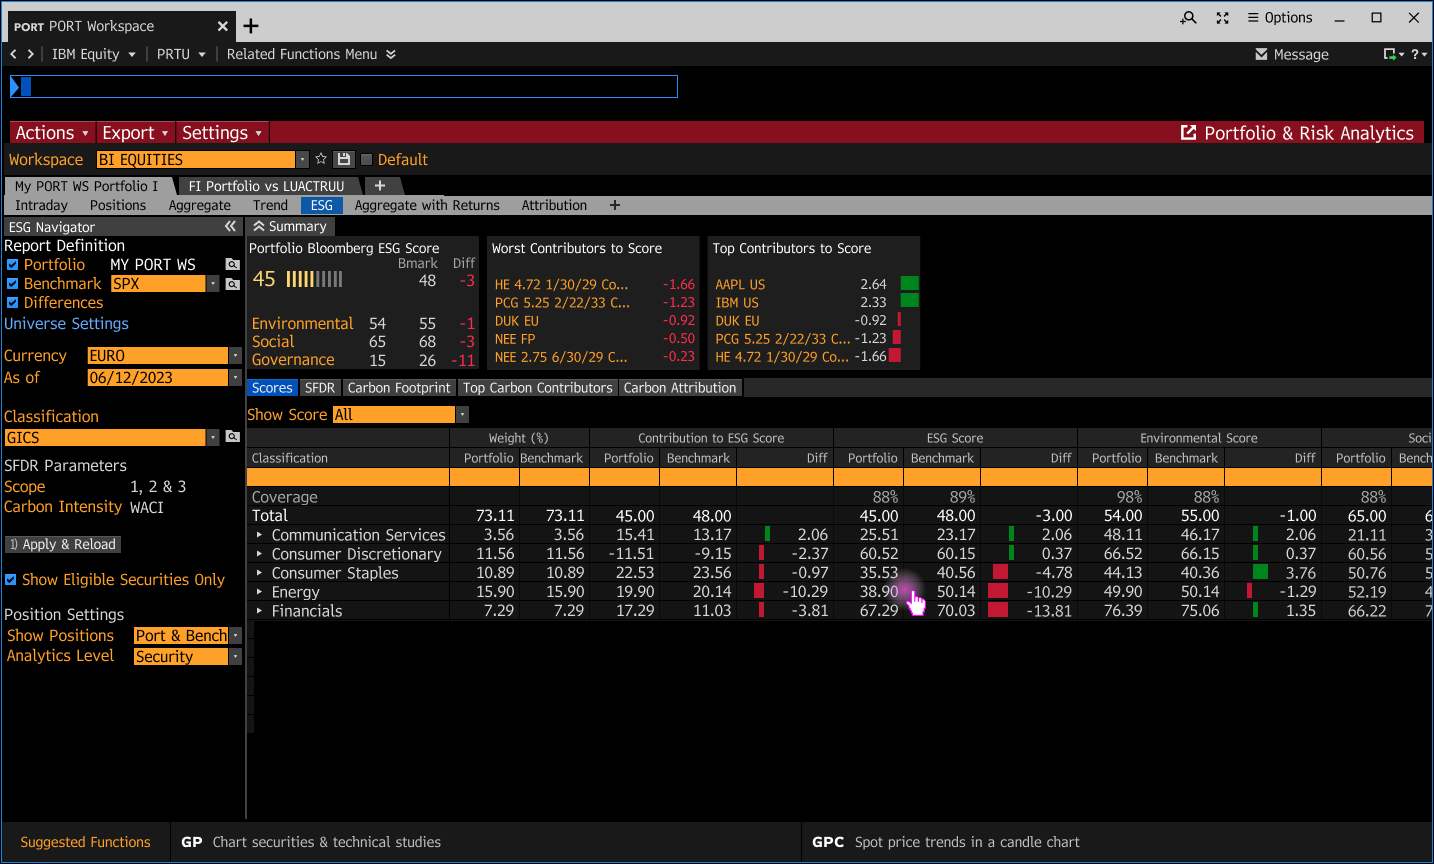
Within PORT Workspace, there were two models to explore portfolio data. One has a grid with data shown for either holdings or simple aggregate grouping; the other focused on aggregate-data-level only and contains a drill-down interaction to focus on security level data, with other columns or information.
I wanted to confirm if ESG scores data was parallel between aggregate and holdings, or whether there was a reason to differentiate each by using the drill-down interaction.
Moreover, I had a key workflow question that had never been addressed: did the PM’s that used classifications (groupings) to view their portfolio only want to view their world by classification (then view holdings under that group), or was their a potential need for them to “throw away” their classifications and just see ESG data in a holdings view only?
I explored the following interaction grid models for how portfolio managers could analyze ESG data:
Aggregate benchmark tree-view,
Drill-down from aggregate to holdings-level,
A flexible approach allowing users to move between both — likely a post-MVP build.
Technical feasibility was top of my mind during the grid interaction model exploration. Some grid models meant taking on more implementation complexity than a single-view approach would have required. I therefore partnered closely with engineering throughout design to chime in on technical feasibility early, rather than after the design was finalized.
Tree-view model
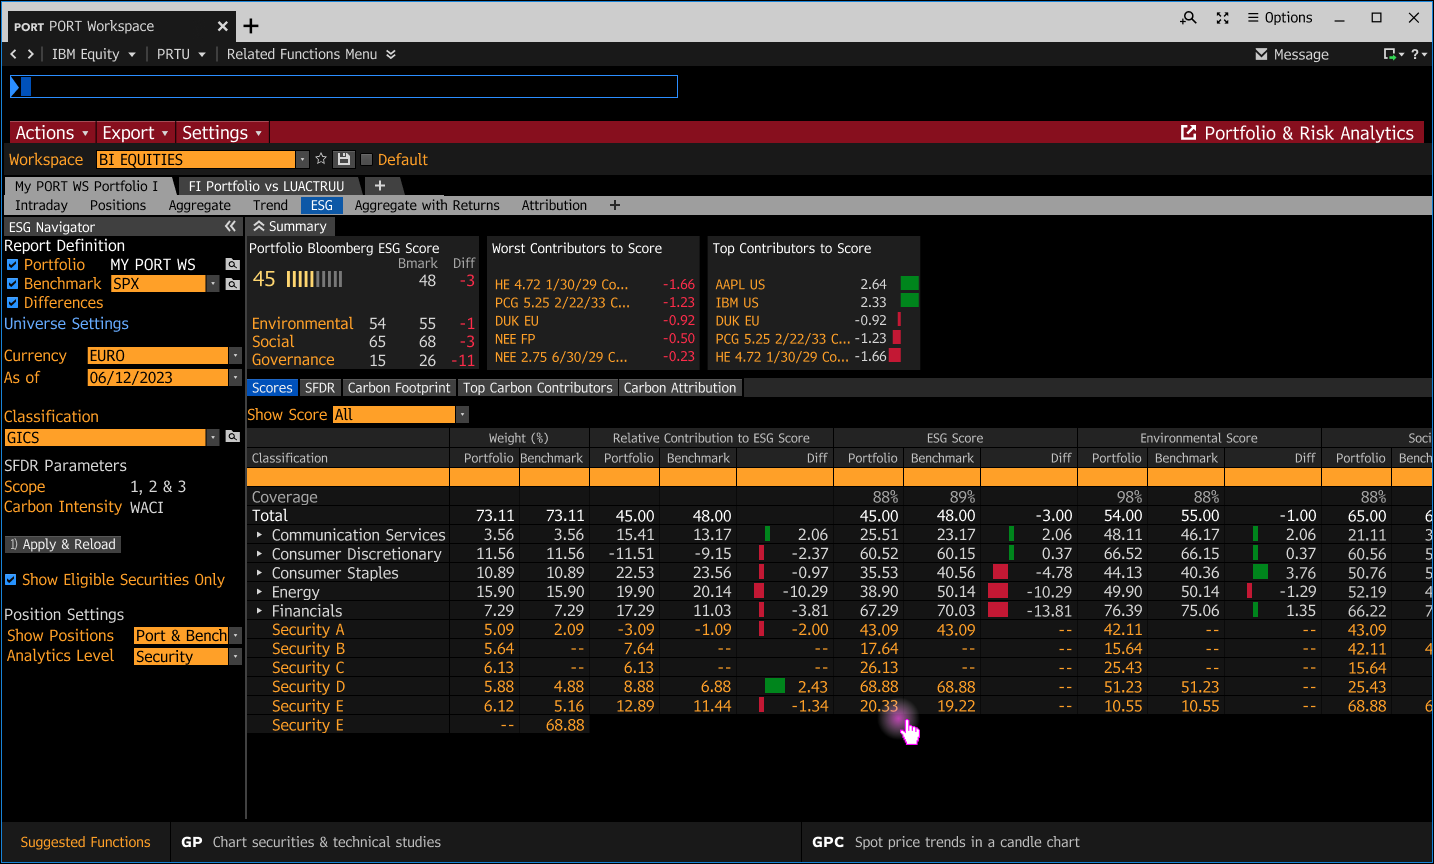
Drill-down model
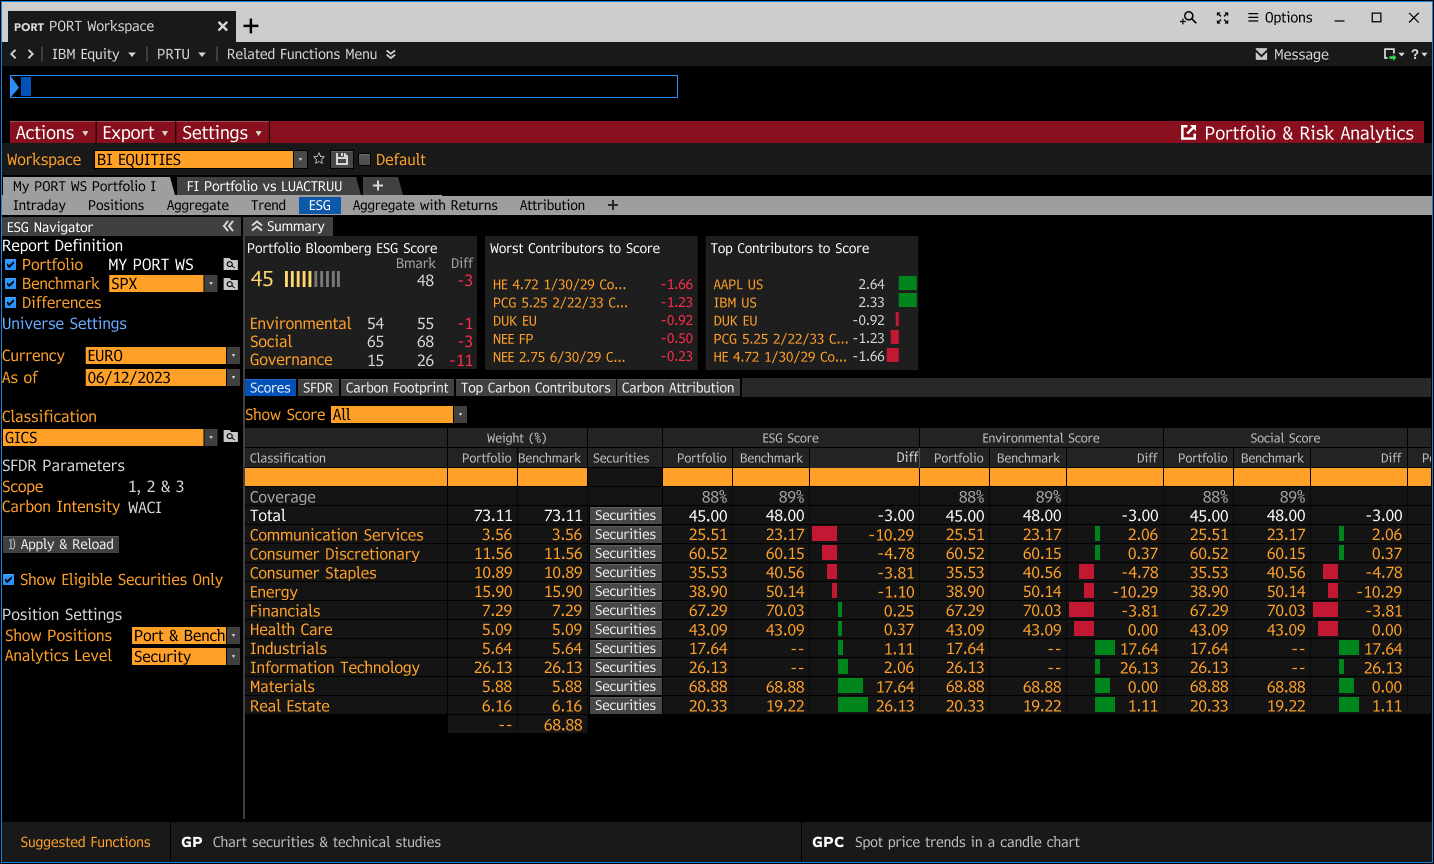
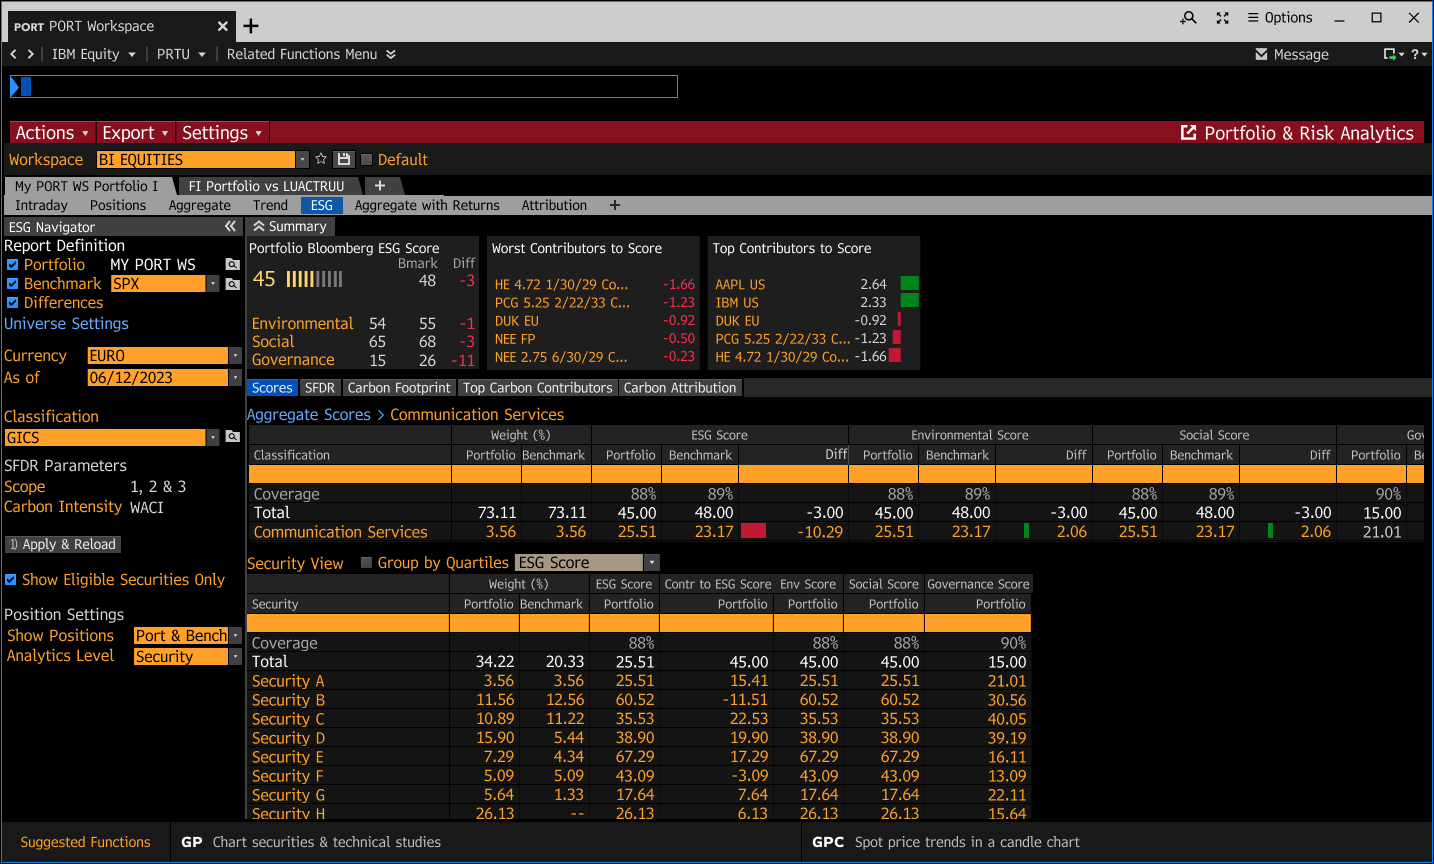
I did rapid validation sessions with 2 portfolio managers on both grid interaction models — tree-view or drill-down aggregate.
We also asked questions about the third, flexible, approach of fluidly moving from holdings to aggregate level view.
The users confirmed that flexibility was essential: they needed simultaneous visibility into grouped and holdings-level data to shift analytical strategy dynamically during decision-making.
This directly shaped the grid interaction model selected for the MVP, and later feature to include post-MVP.
DESIGN
Final MVP
The final experience introduced ESG portfolio analysis directly into PORT through:
Aggregate and holdings-level ESG visibility, prioritizing user analysis needs
Summary tile metrics for quick overview and scope of portfolio health
Visual indicators within the grid to easily surface portfolio score risk areas against benchmark
The solution aligned with existing PORT interaction patterns to reduce onboarding friction while extending the platform’s analytical capabilities.
Summary metrics for quick access to portfolio health
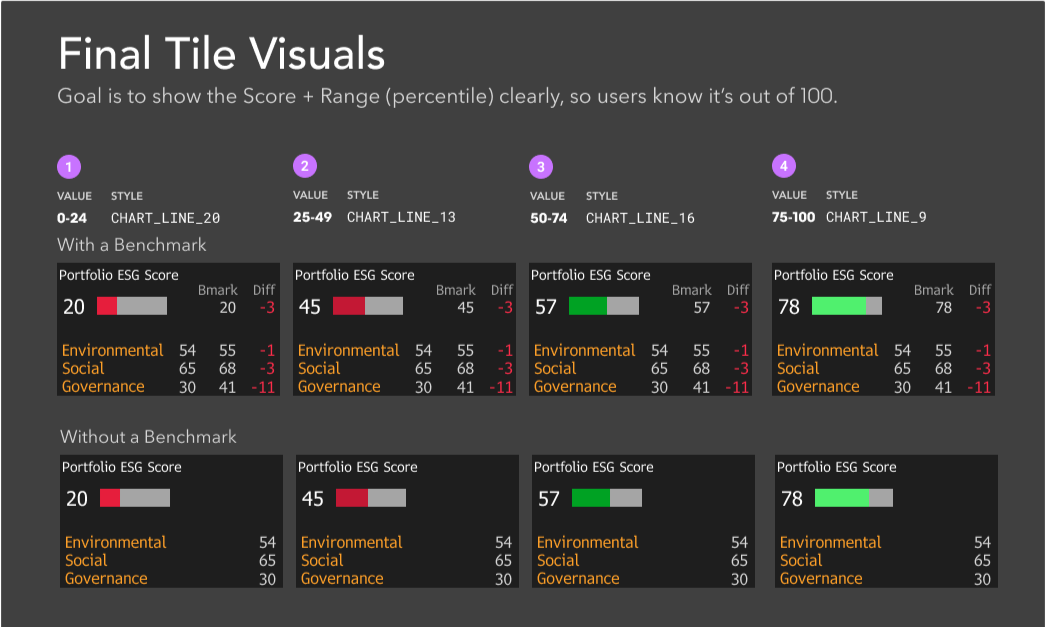
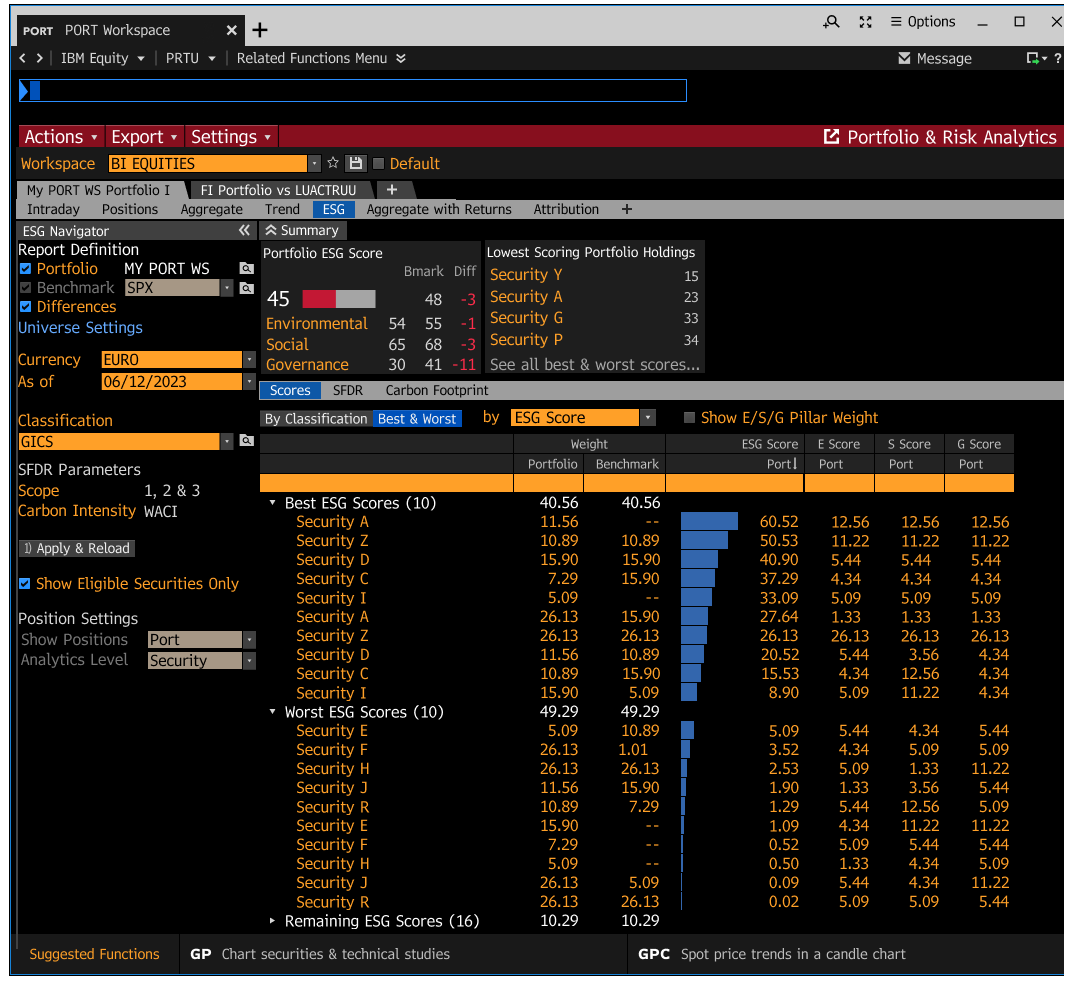
Bar chart visuals added in the grid to help prioritize aggregate analysis, and flexibility viewing holdings level
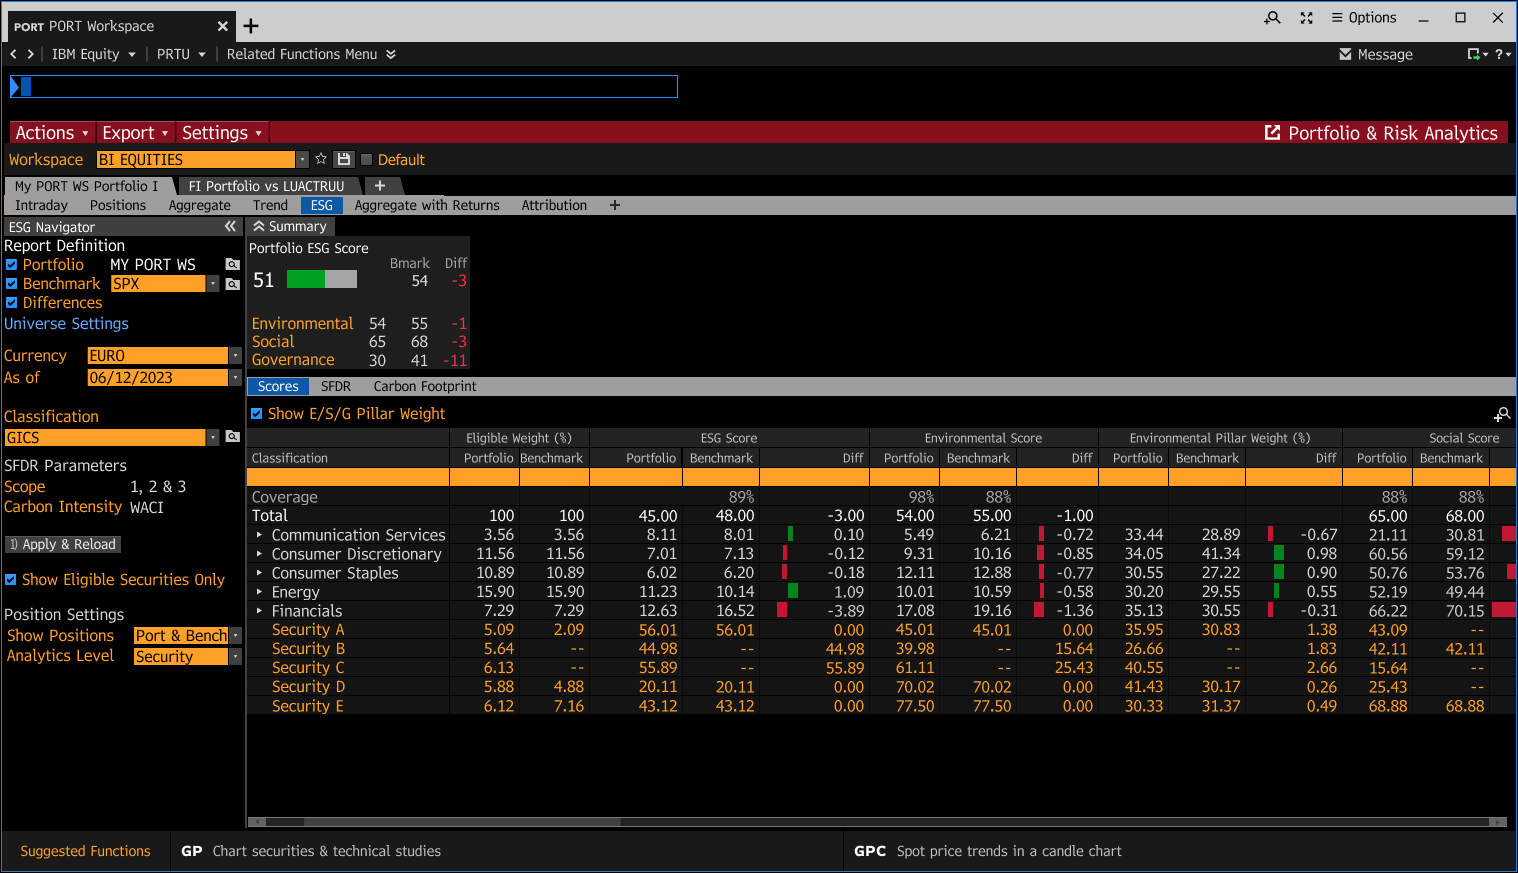
Consulting after MVP
In the midst of working on the MVP design, I began collectively bridging the next iteration with product based on prior discussions.
We aligned on the need for benchmark driven users to pivot to seeing top/bottom ESG data on a holdings view level only (i.e. the comparison with a benchmark, or aggregate approach, no longer applies once they have an idea of where they stand).
After discussing as a team, I quickly began exploring concepts that could be elaborated on in the next iteration - later passed to my colleague, given my team’s resource constraints.
Initial Concept Explorations
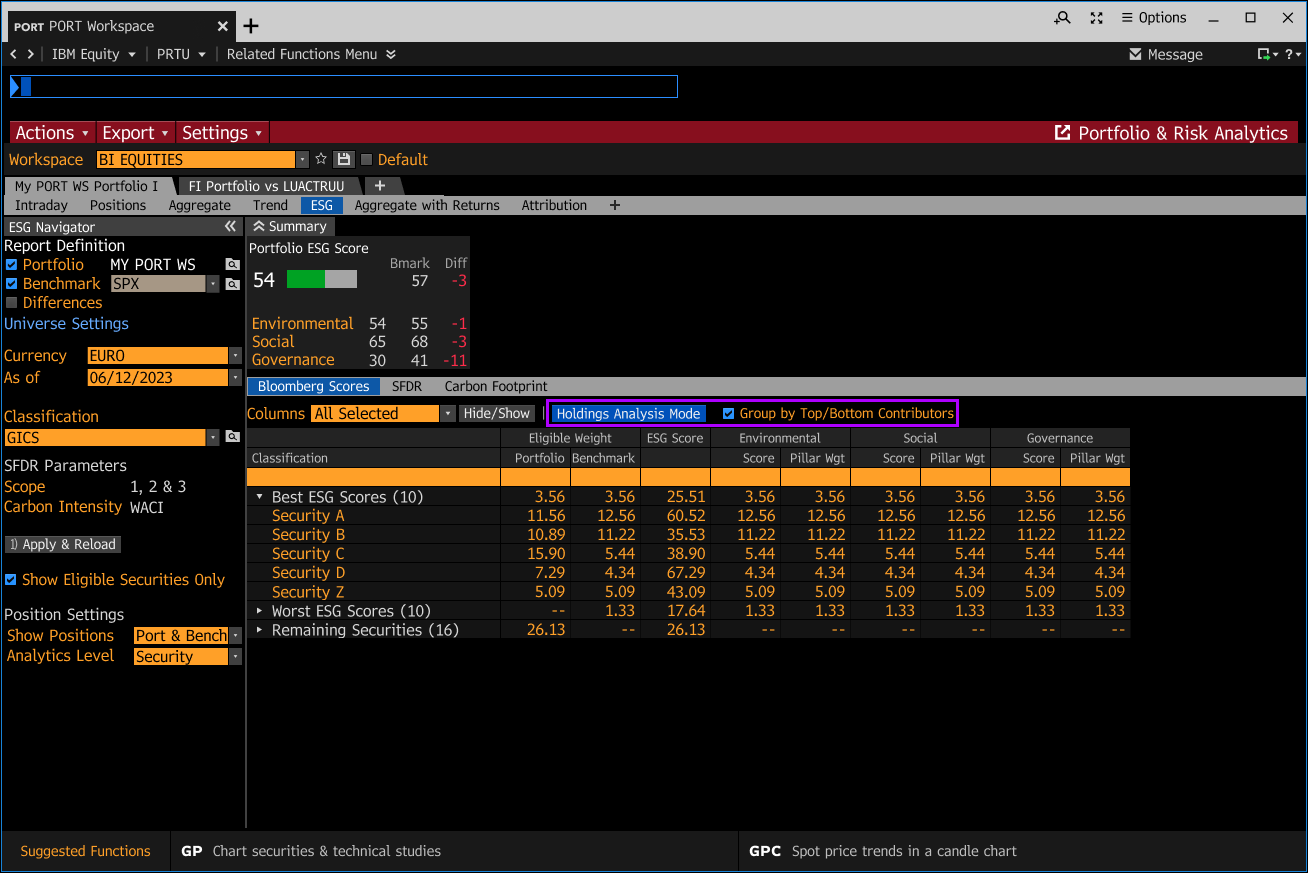
The concept explorations are all below the submenu “Bloomberg Scores”.
Adding a “Holdings Analysis Mode” menutron to easily switch from benchmark driven aggregate view to holdings only when you’re benchmark driven PM.
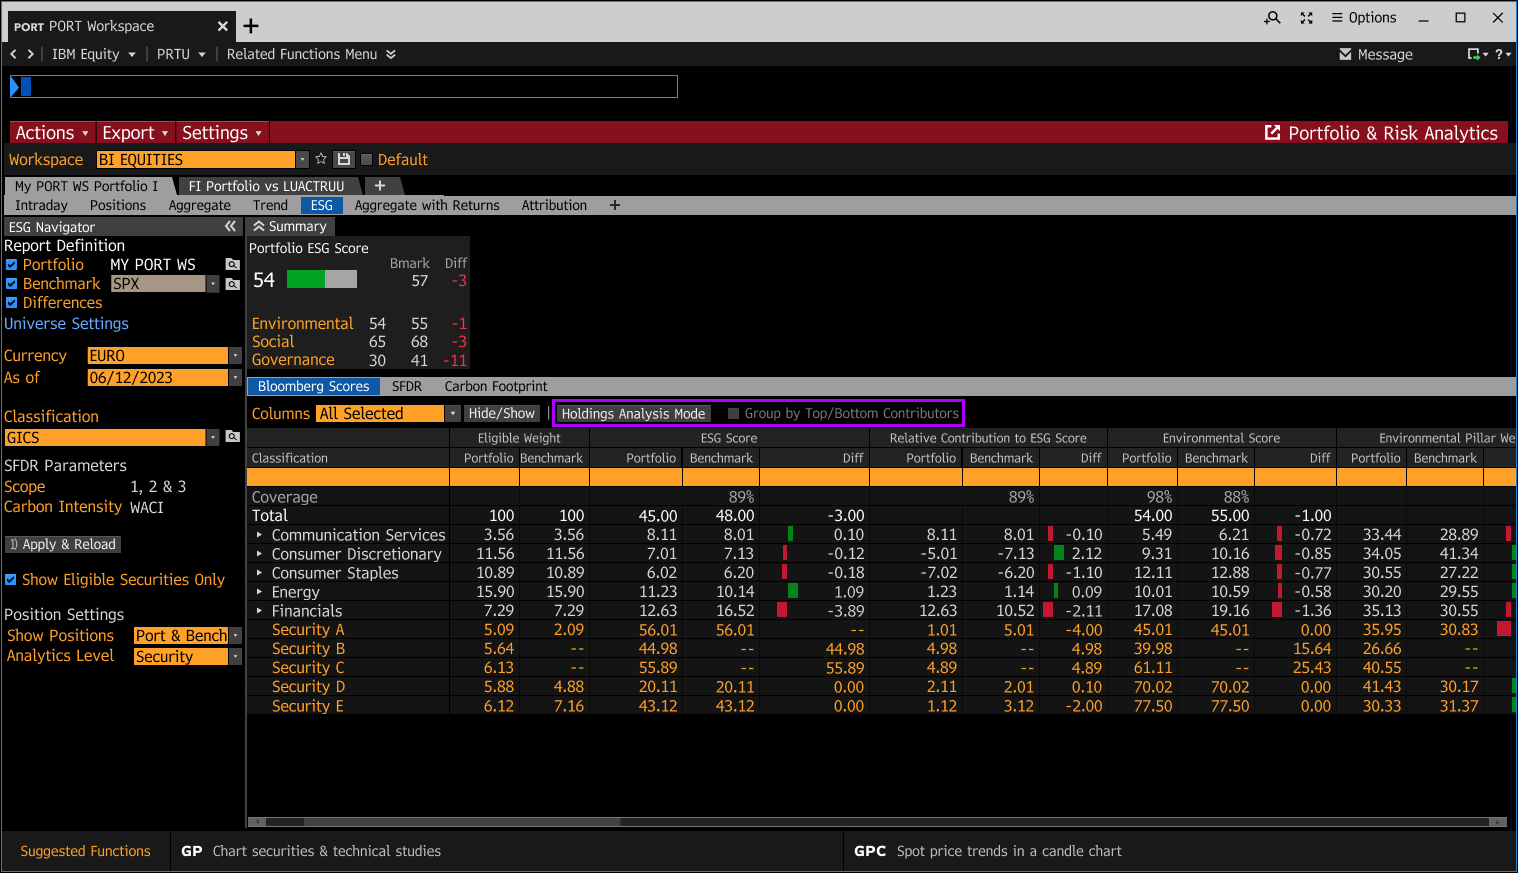
Grouping by top and bottom contributors allows PMs to quickly prioritize actions to take in their portfolio. This allows them to analyze the data in a layered perspective, on-the-fly.
Consulted on the post-MVP direction
After releasing the MVP, I had to change focus to other high priority projects. My peers took over the rest of my explorations after MVP, and I took a consultative role — helping bridge knowledge gaps on the topic and strategy discussions, clarifying and addressing any questions that arose around the project history, product, or users.
OUTCOME
Product Impact
Delivered an MVP that integrated the most important ESG data into the PORT product, aligning with existing PORT interaction patterns to minimize onboarding friction.
Avoided a costly late-stage redesign by killing the high-density concept early, based on direct proxy-user testing rather than internal opinion.
Validated the core interaction model with real portfolio managers before full implementation, reducing the risk of building the wrong workflow.
Established a foundation and a validated set of unmet needs (e.g., complex workflows) for future ESG workflow iterations in PORT.
Improved stickiness of the terminal by incorporating Bloomberg ESG Scores in one of the most used portfolio management tools.
Influenced product direction of ESG scores by facilitating roadmap discussions and pushing the boundaries of the problem.
Team & Organizational Impact
Aligned two product teams, ESG and PORT, and an engineering lead around a shared MVP direction within a compressed timeline.
Mentored and onboarded a new designer by integrating her directly into a live, cross-functional project.
REFLECTION
Final thoughts
This project reinforced the importance of designing enterprise systems holistically rather than optimizing isolated interactions. Navigating evolving requirements, cross-functional alignment, and workflow complexity required balancing speed, clarity, scalability, and product strategy simultaneously.