Bloomberg LP
Adding ESG Performance in Portfolio Analytics
MY ROLE
Lead Designer
UX Researcher
SCOPE
Research, Design
Build support
TOOLS
Figma
Google Suite (Sheets, Doc)
Bloomberg LP is a financial software company providing data and other services to financial institutions and investors.
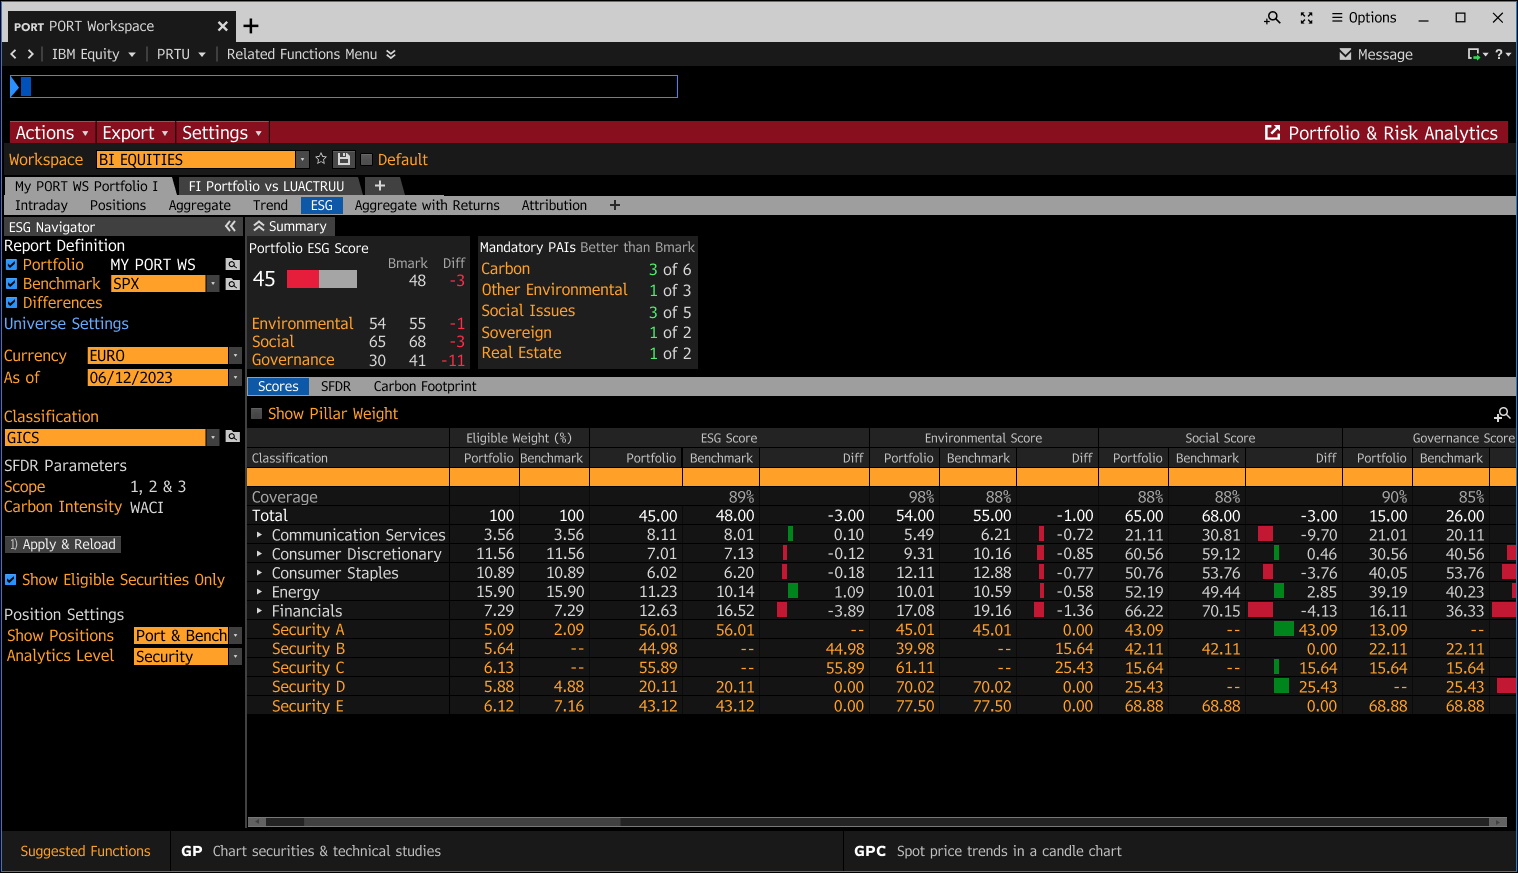
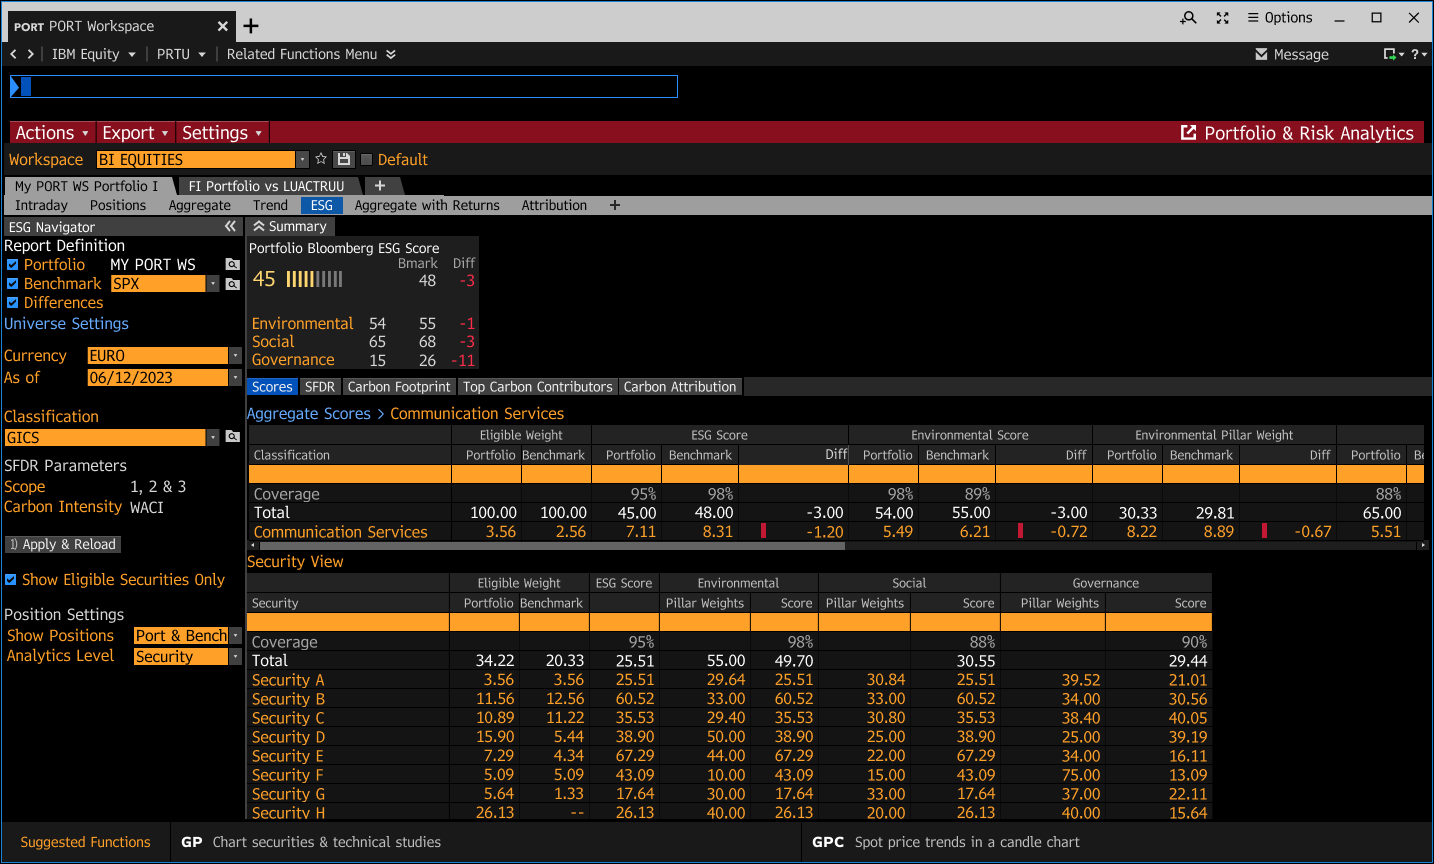
The Portfolio Risk & Analytics product provides institutional portfolio managers transparency into their portfolio’s performance, characteristics, and risk so that they can make better decisions based on their portfolios’ goals.
Project Overview
Context
The ESG (Environmental, Social and Governance) team partnered with the Portfolio Risk and Analytics, PORT, product team to add ESG data into the portfolio management product. I primarily worked with the ESG product manager and further served as a liaison for this project between the PORT and ESG product managers.
Problem
There was no current solution for portfolio managers to view ESG related data so that they can make financial decisions based on these important factors. These users use ESG information in order to make portfolio investment decisions related to ESG risks. There’s a market for ESG information and insights, and users were using other products outside of Bloomberg to get this data.
Goal
The product goal was to increase discoverability of Bloomberg ESG Scores for PORT users, with the vision of becoming a competitive leading ESG provider to simplify users’ access to ESG insights. My goal as a designer was to provide easy to digest ESG scores information to entice clients to use the product.
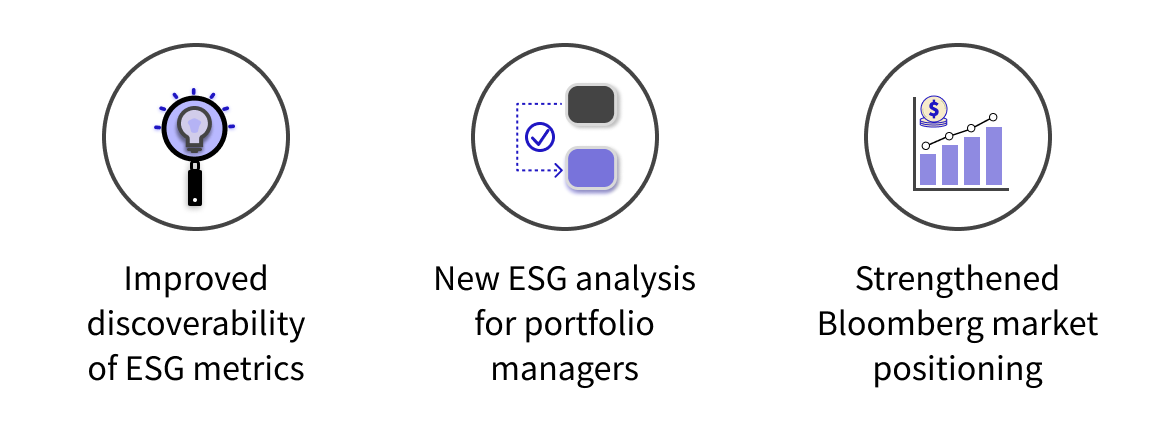
Impact

Case Study
DEFINE
Understanding project scope, business and user goals
Goals of the project
For this project I primarily worked with the ESG product manager, who focused on the Core terminal (a different business vertical from what I covered, which was Enterprise).
1. Business goals
Increase the discovery of Bloomberg Scores for our PORT users
Boost visibility of ESG scores to become a market leading ESG provider
Round out our ecosystem of tools to lower barriers for customers taking advantage of our ESG data
2. User Goals
The users of ESG data vary. Because we were working on the interactive portfolio management product tool, the primary user base are portfolio managers.
Users have the following motivations for using the ESG scores:
They must have their portfolio(s) comply with ESG score mandates
They need to share their portfolio ESG data with clients/investors who care
They need to Assess portfolio’s financial risks via ESG scores
Self-Led and Secondary Research
I had to vamp up my knowledge around ESG and what type of data portfolio managers sought and why.
The ESG world has certain standards, but is a work in progress. Moreover, the score computation is pretty technical and I needed to understand what the data meant and why it was important for clients.
I did a lot of self-led research online and met with different stakeholders to facilitate my collaboration with this team and my product knowledge.
This upfront work later led to great product development questions, which led to shaping many product features.
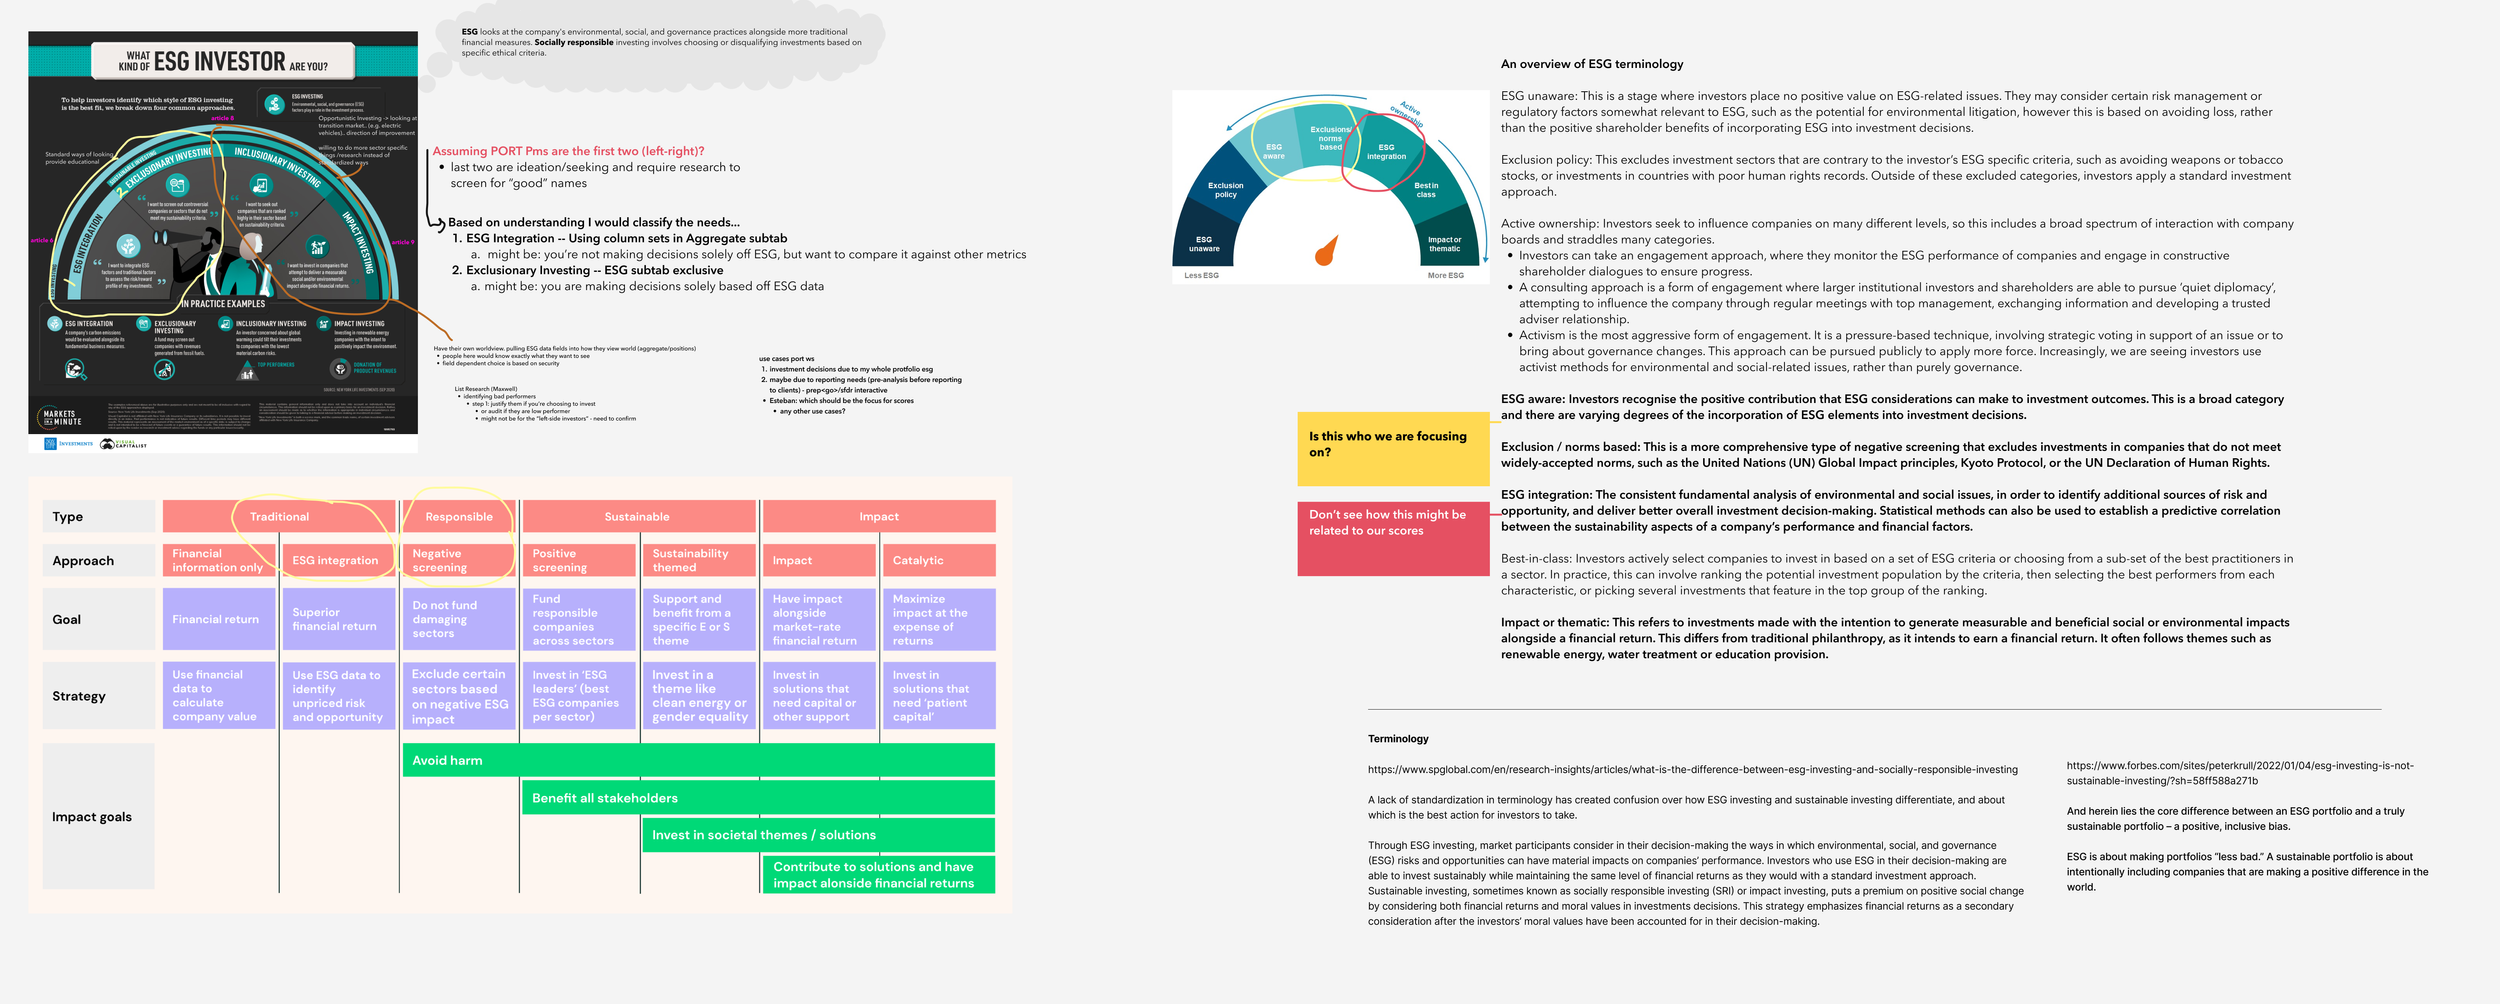
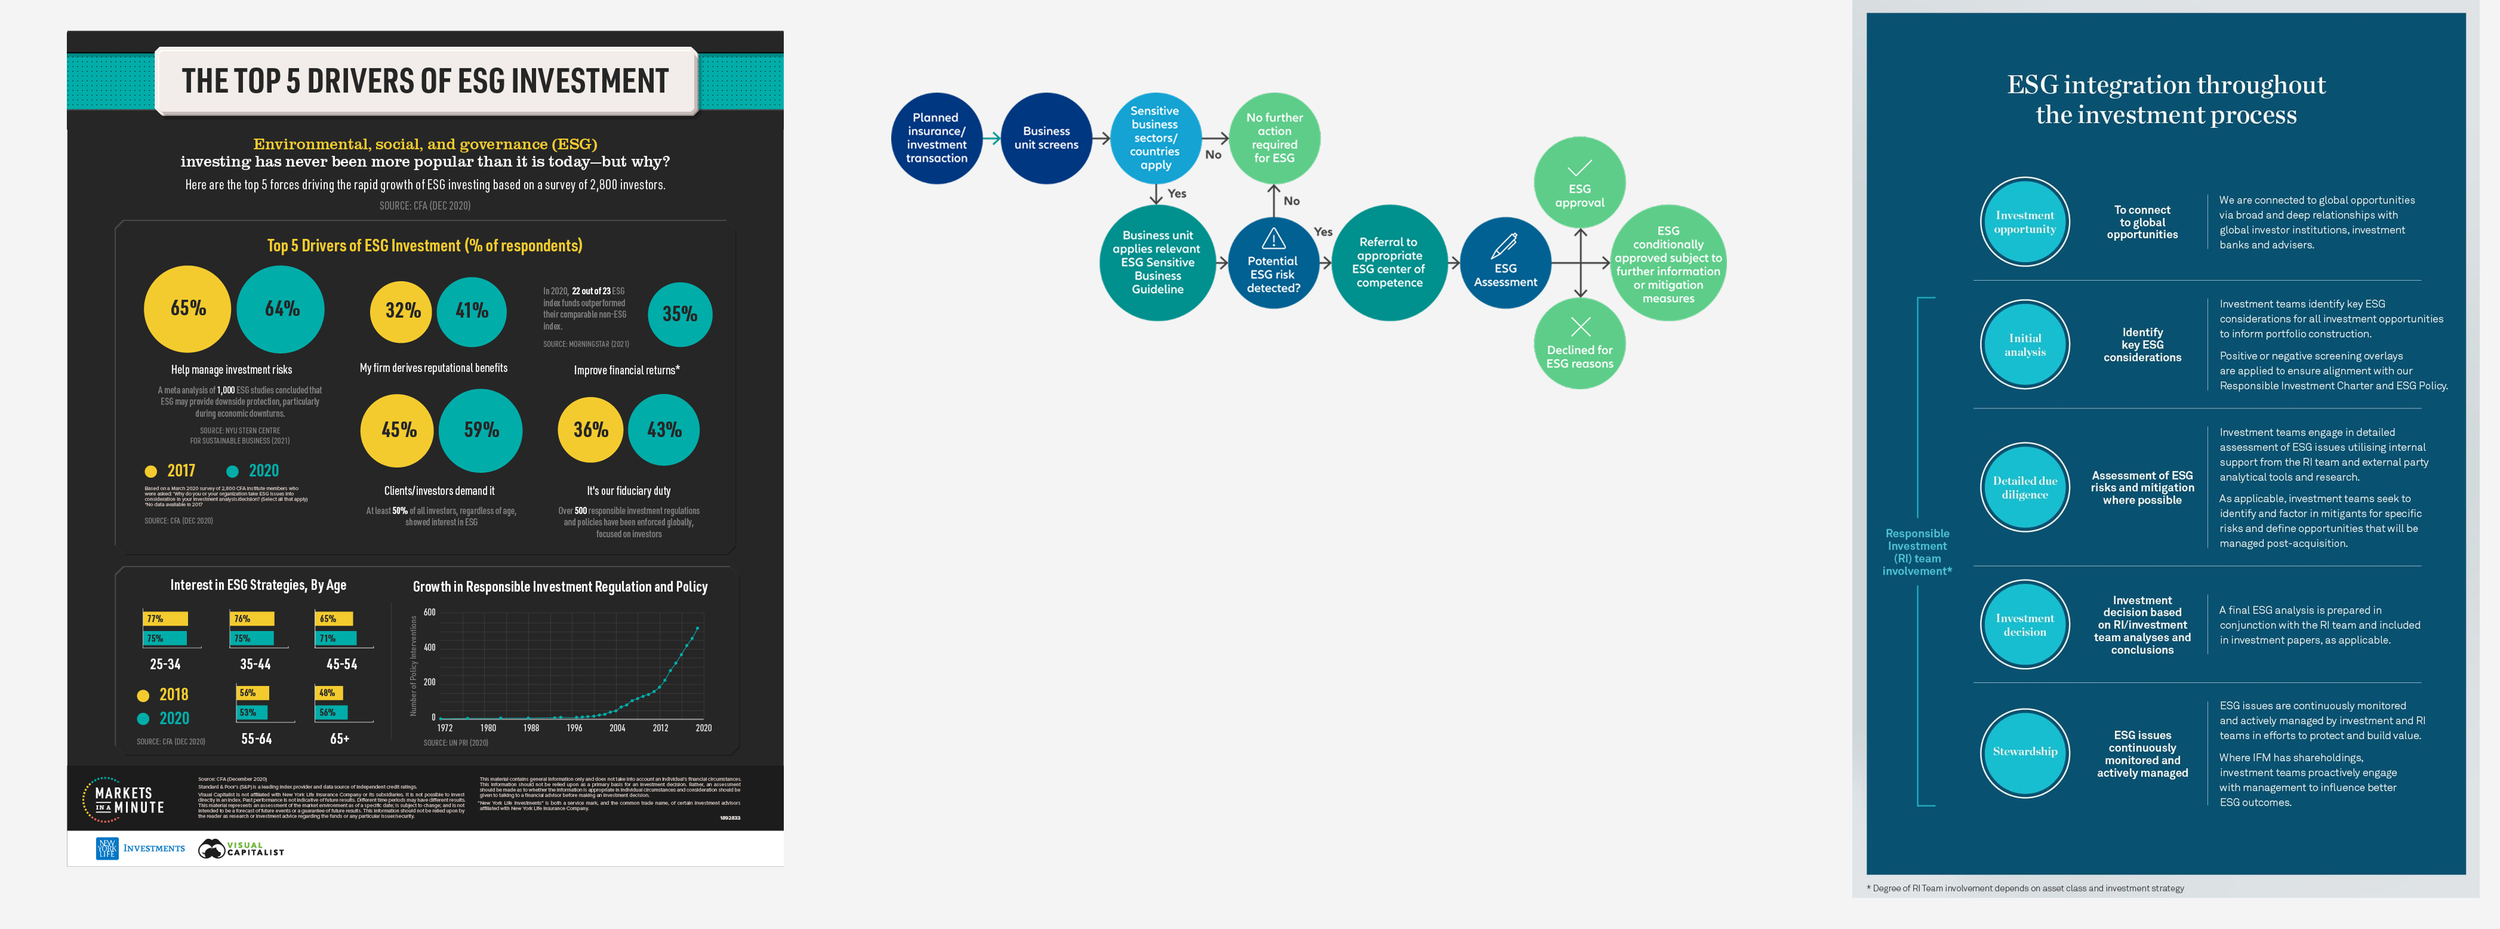
Secondary research I reviewed and notes I took to better understand the concept of ESG scores.
Building empathy
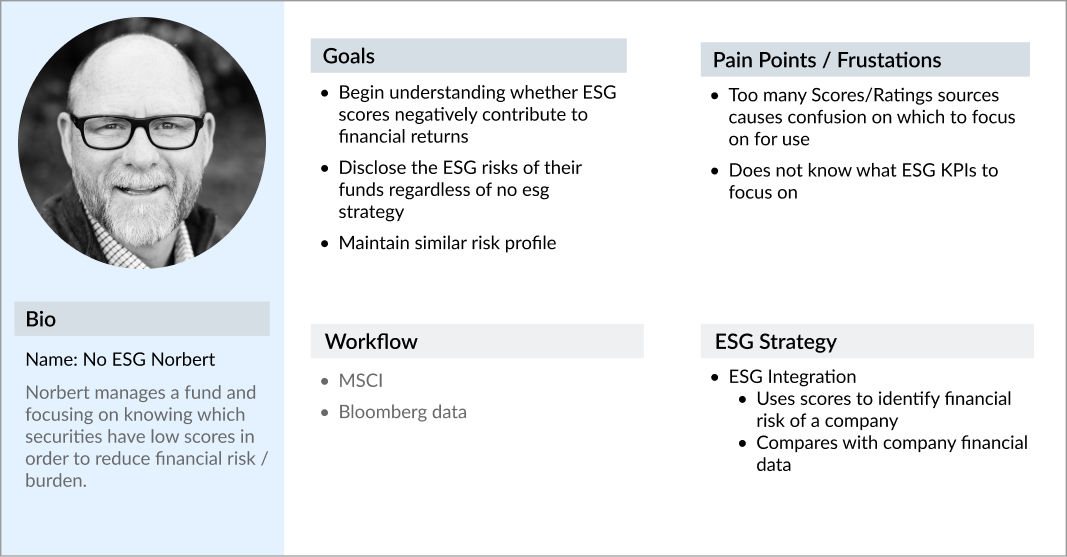
User Archetypes
Alongside my own research, I led various discussions with product and other stakeholders to understand the different use cases for ESG scores within the portfolio management space.
I categorized these archetypes based on the way they classify their funds — given the fact that that informs us what type of features they need to see. The classifications are: Article 6, 8, 9. The ESG data needs increase as you classify your fund from a 6 to an 8, or an 8 to a 9.
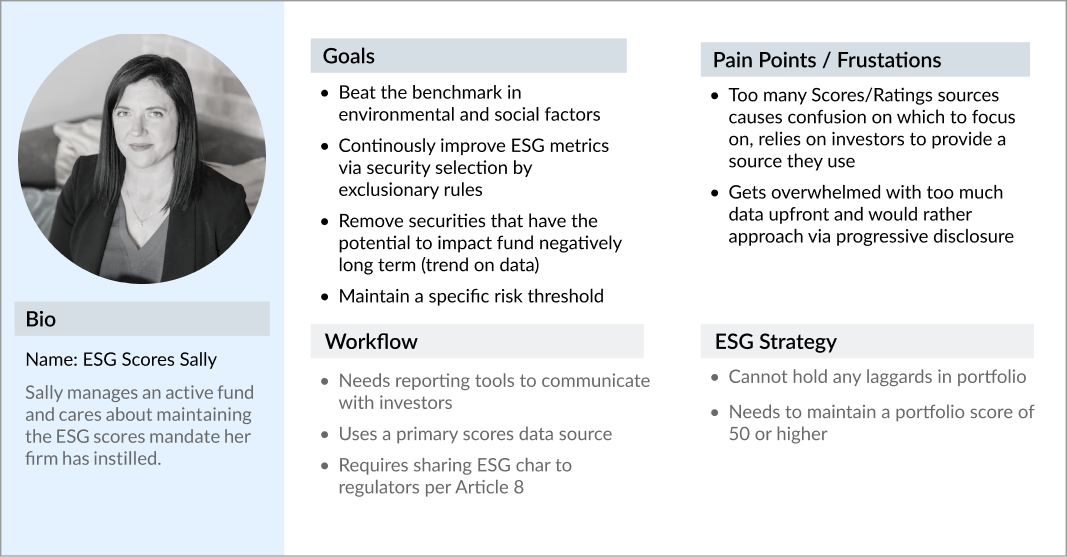
The following archetypes aligned the team to understand which user we were focusing on for the MVP.
Use cases taken into consideration for MVP design.
Client funds that are labeled as “Article 6” do not have ESG mandates and require the least amount of ESG information. Given the scope of this project and feature needs, this archetype was considered for our MVP build.
Client funds that are labeled as “Article 8” have more ESG mandates and typically care about the ESG performance in their funds. Given the scope of this project and feature needs, this archetype was considered for our MVP build.
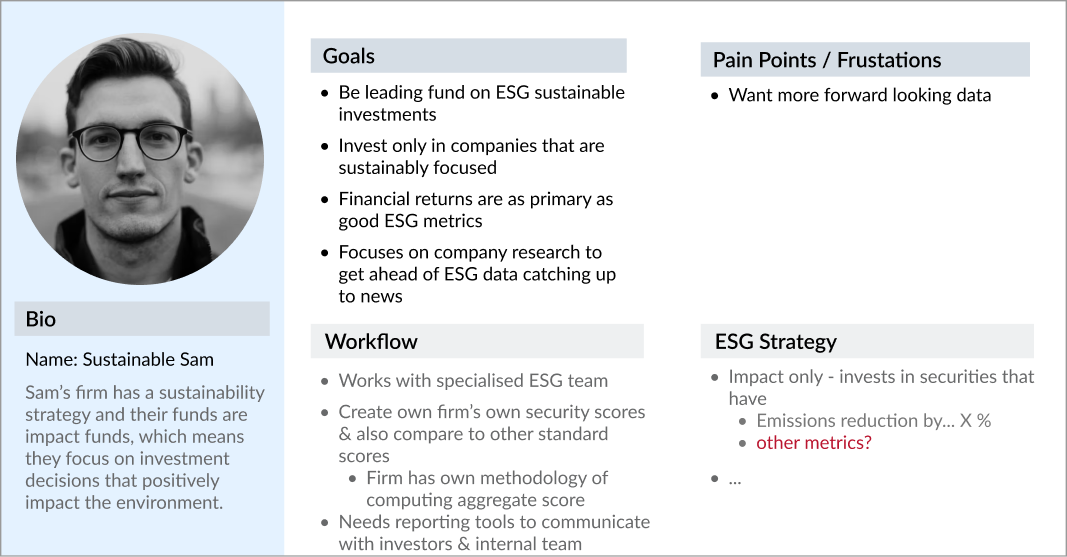
Use case not taken into consideration for MVP design.
Client funds that are labeled as “Article 9” have stricter ESG mandates and require more complex layers of ESG information, not to mention they create their own ESG scores & metrics. Given the scope of this project and feature needs, this archetype was not considered for our MVP build.
Understanding MVP feature scope
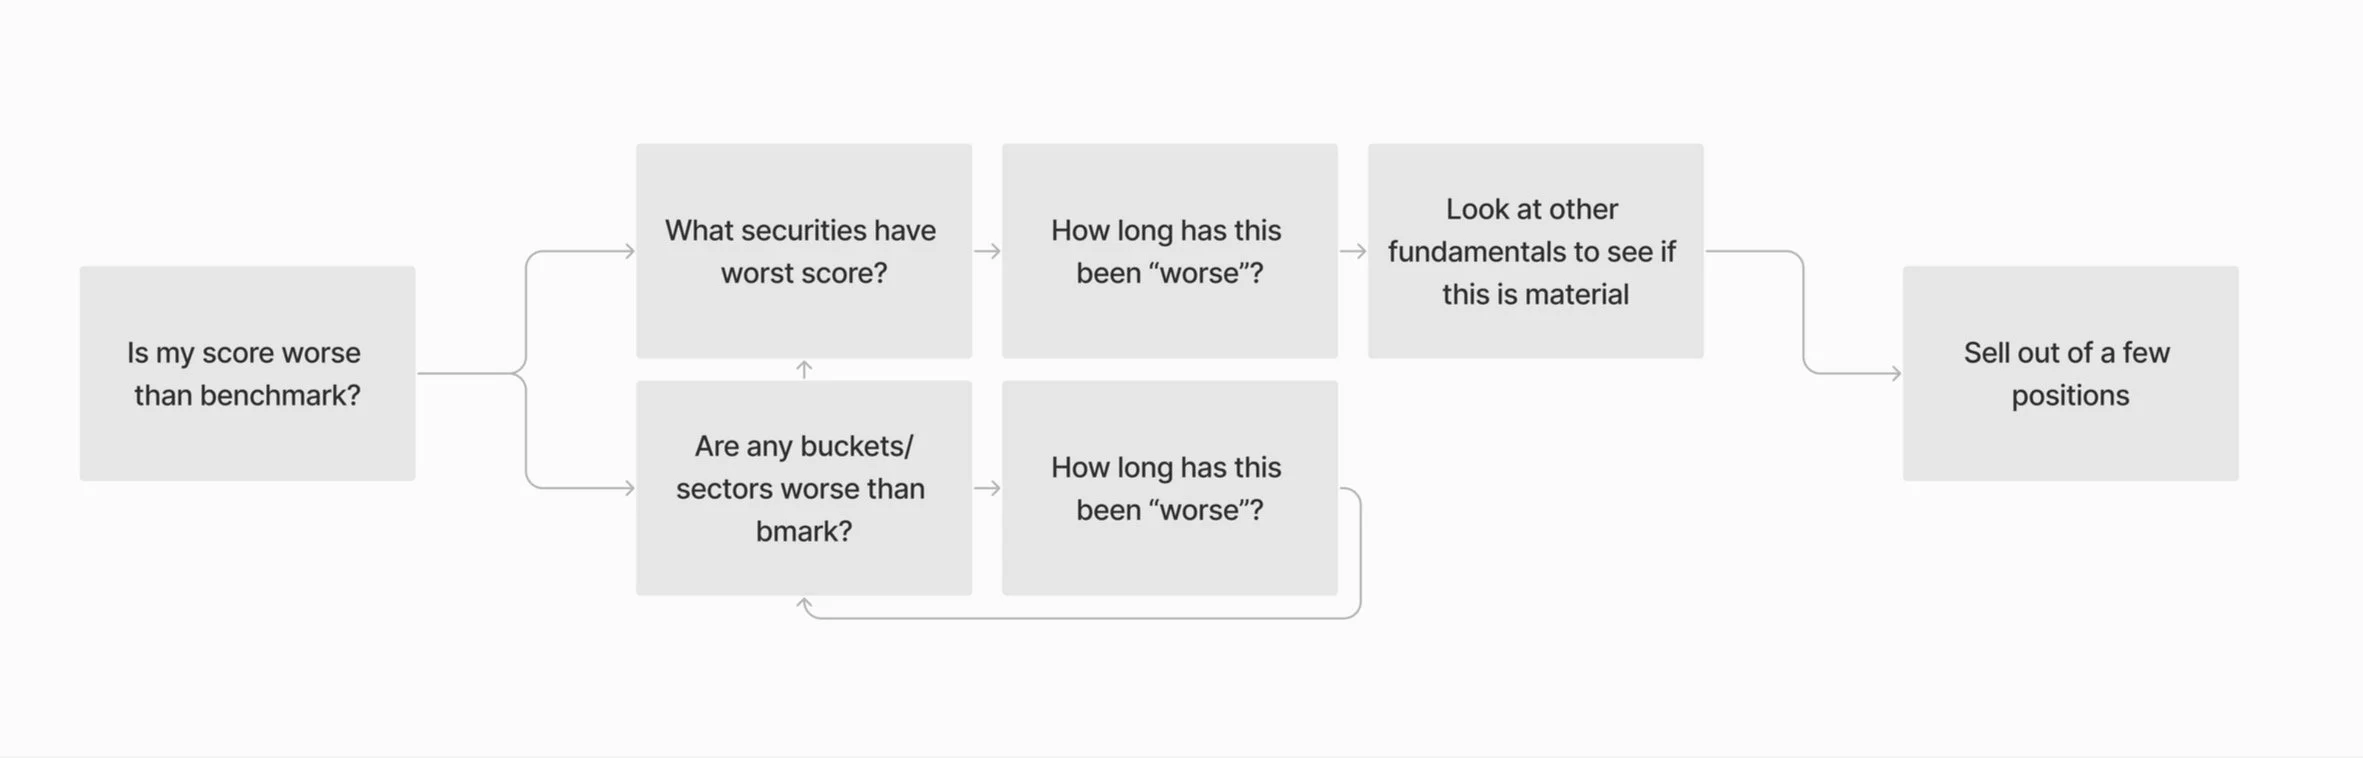
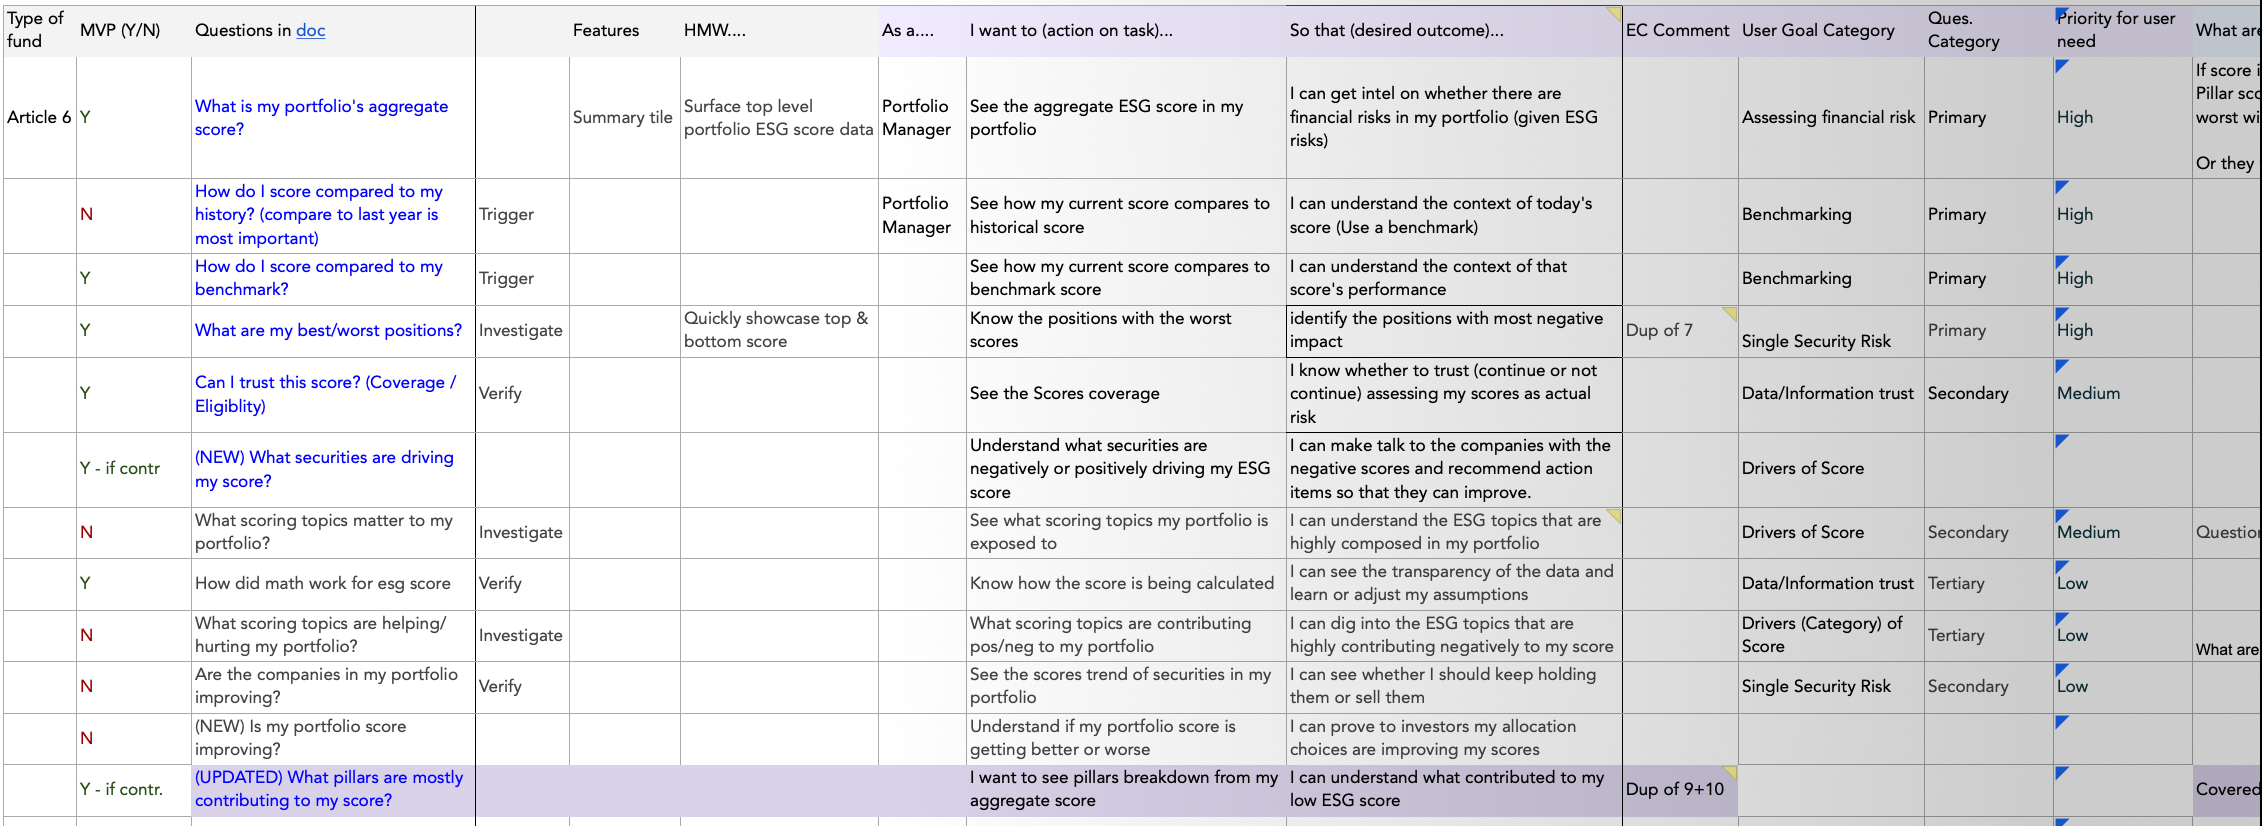
User Questions
There were the following main questions that clients who fell under the archetypes—that we categorized into Article 6 and 8—cared about.
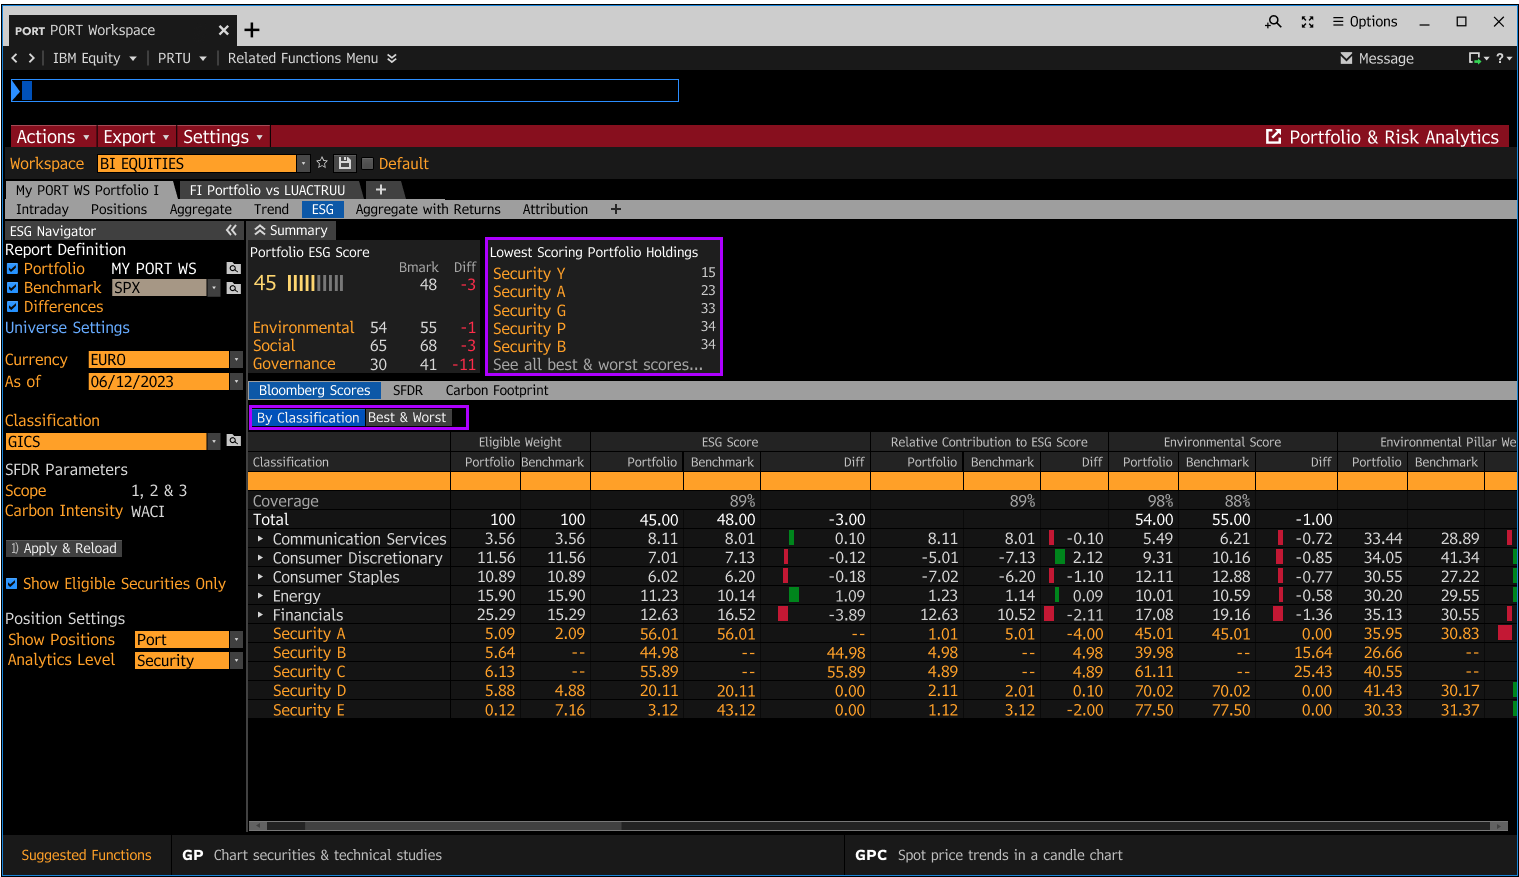
What is my portfolio’s aggregate score?
How do I score compared to my benchmark?
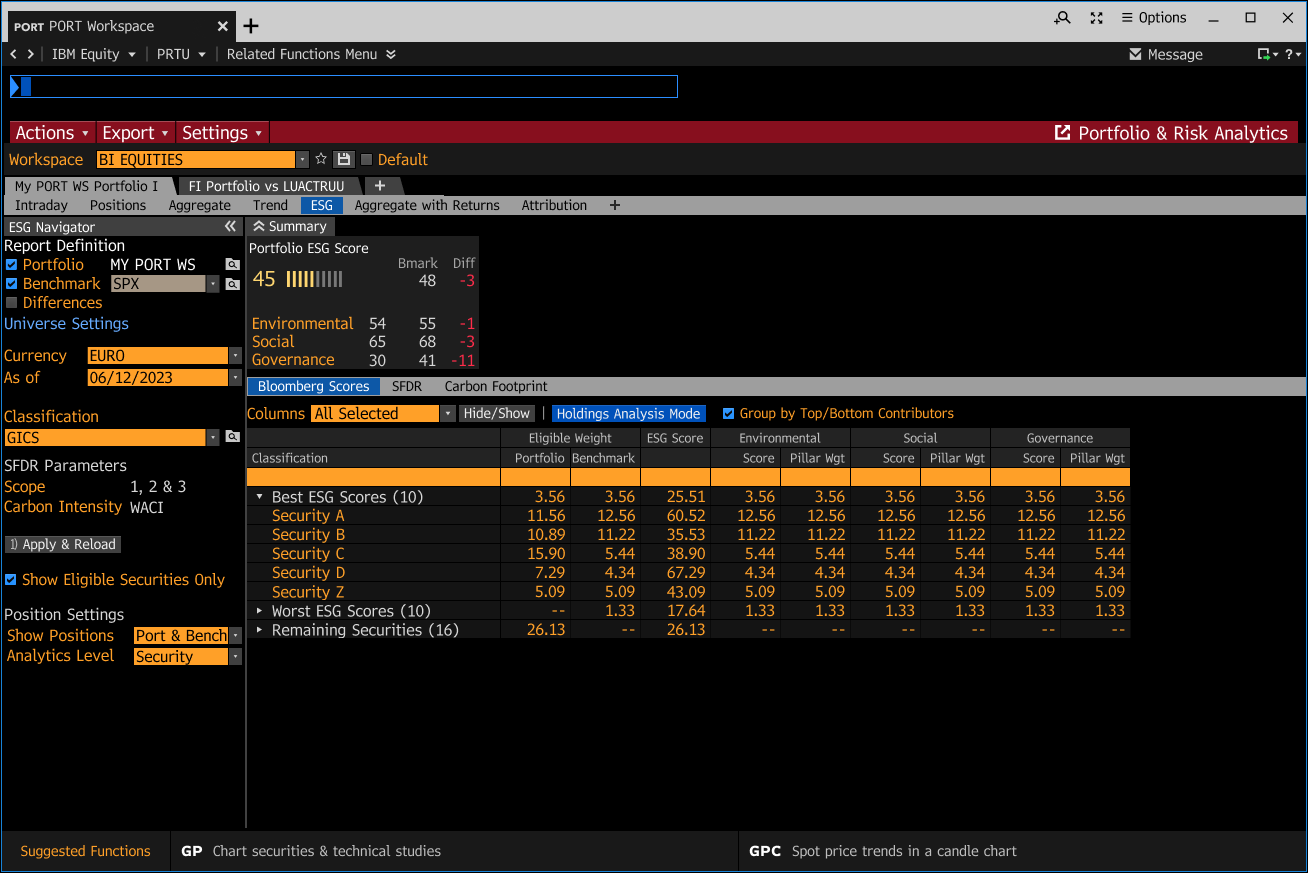
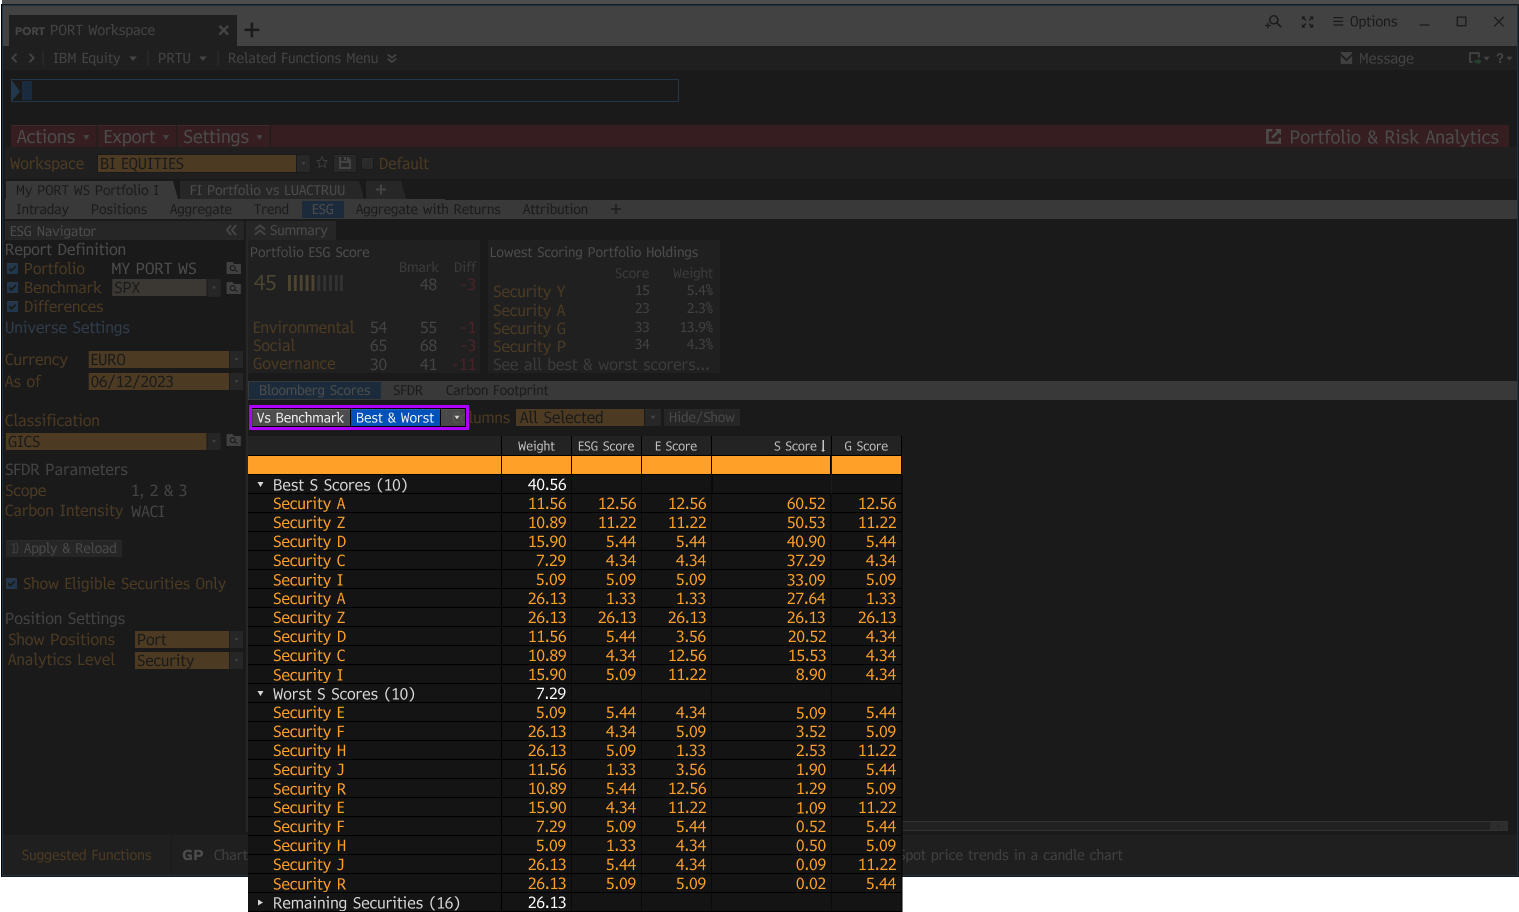
What are my best/worst positions?
This simple flow diagram highlights the user questions and needs that we focused on.
IDEATION & RAPID VALIDATION
I began exploring design concepts
I had been undergoing design explorations while still understanding the problem space with the product manager given project timelines. Given the product manager’s keenness on providing users a quick way to see a breakdown of their portfolios ESG scores, we tested out a couple of concepts with two proxy users.
The immediate feedback was discussed with product. Given the fast timelines, these concepts were not pursued because there was no strong use case that validated those features needs, not to mention, the primary focus was to create an MVP product for our ESG users.
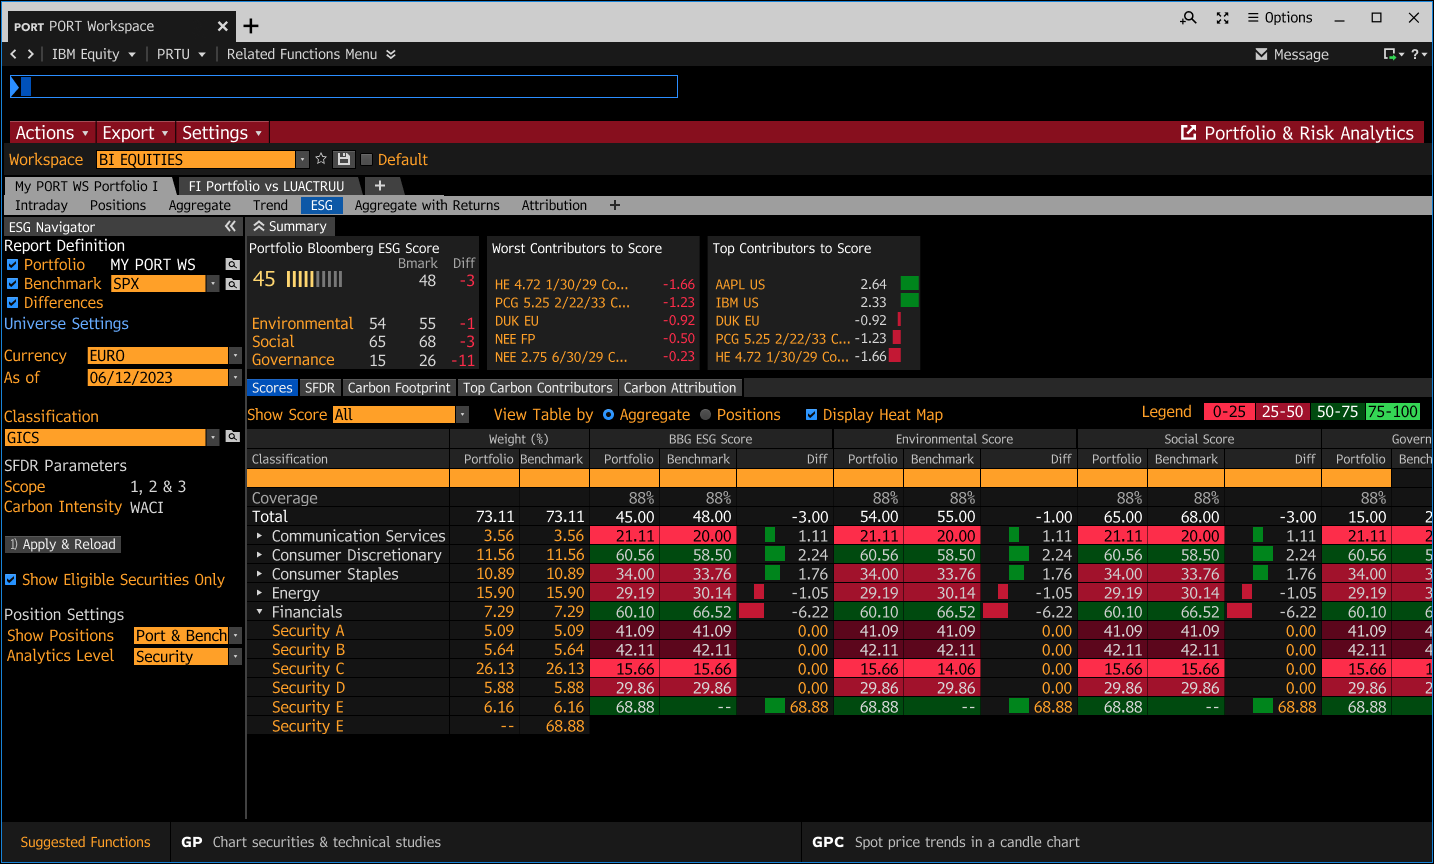
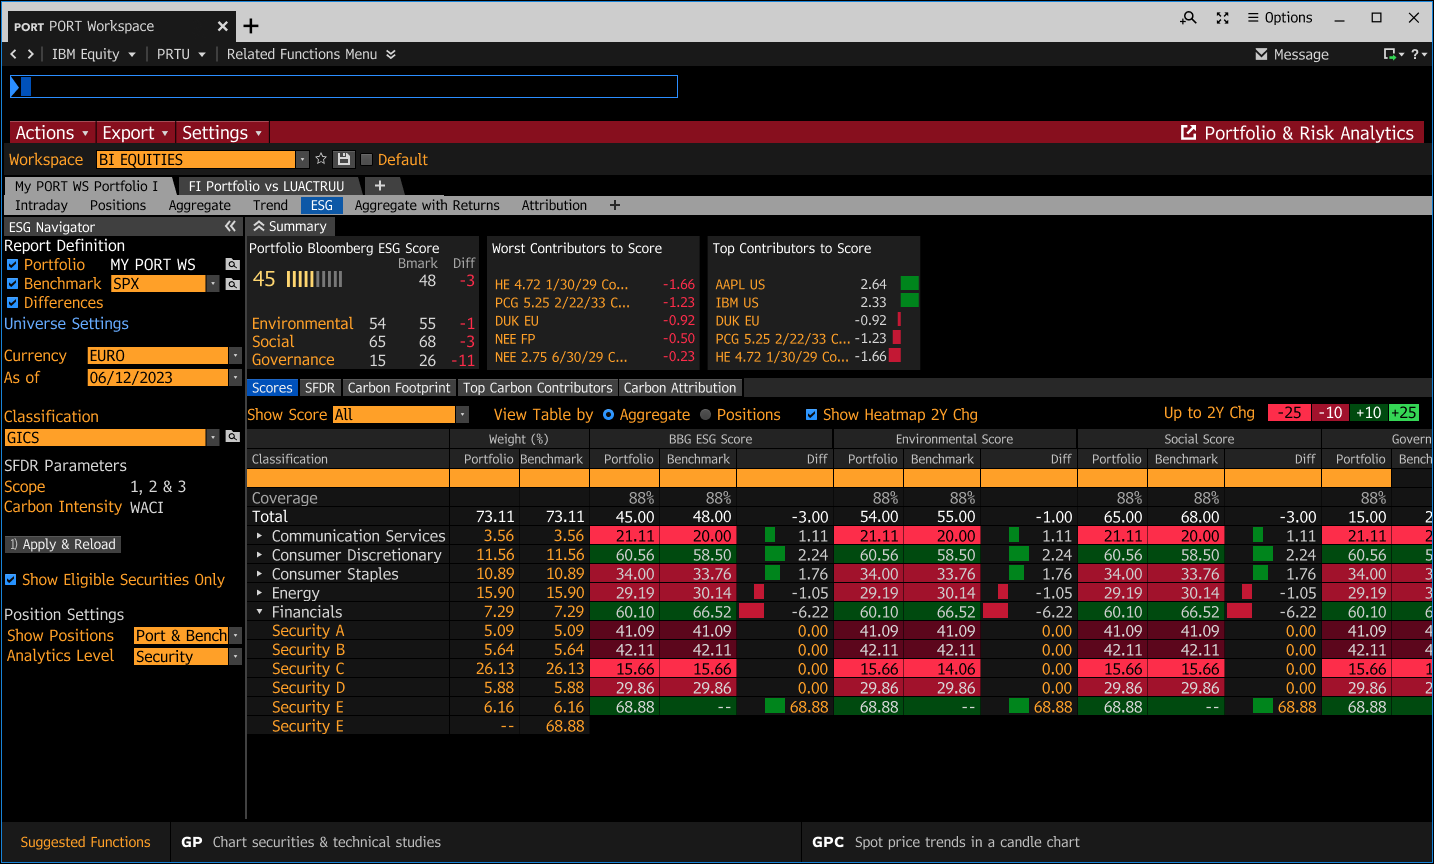
The following design concepts were tested with proxy users to identify design direction.
A Histogram version showcased how a portfolio measured against its benchmark given a breakdown of ESG performance in the following categories: Leaders, Above Median, Below Median, Laggards.
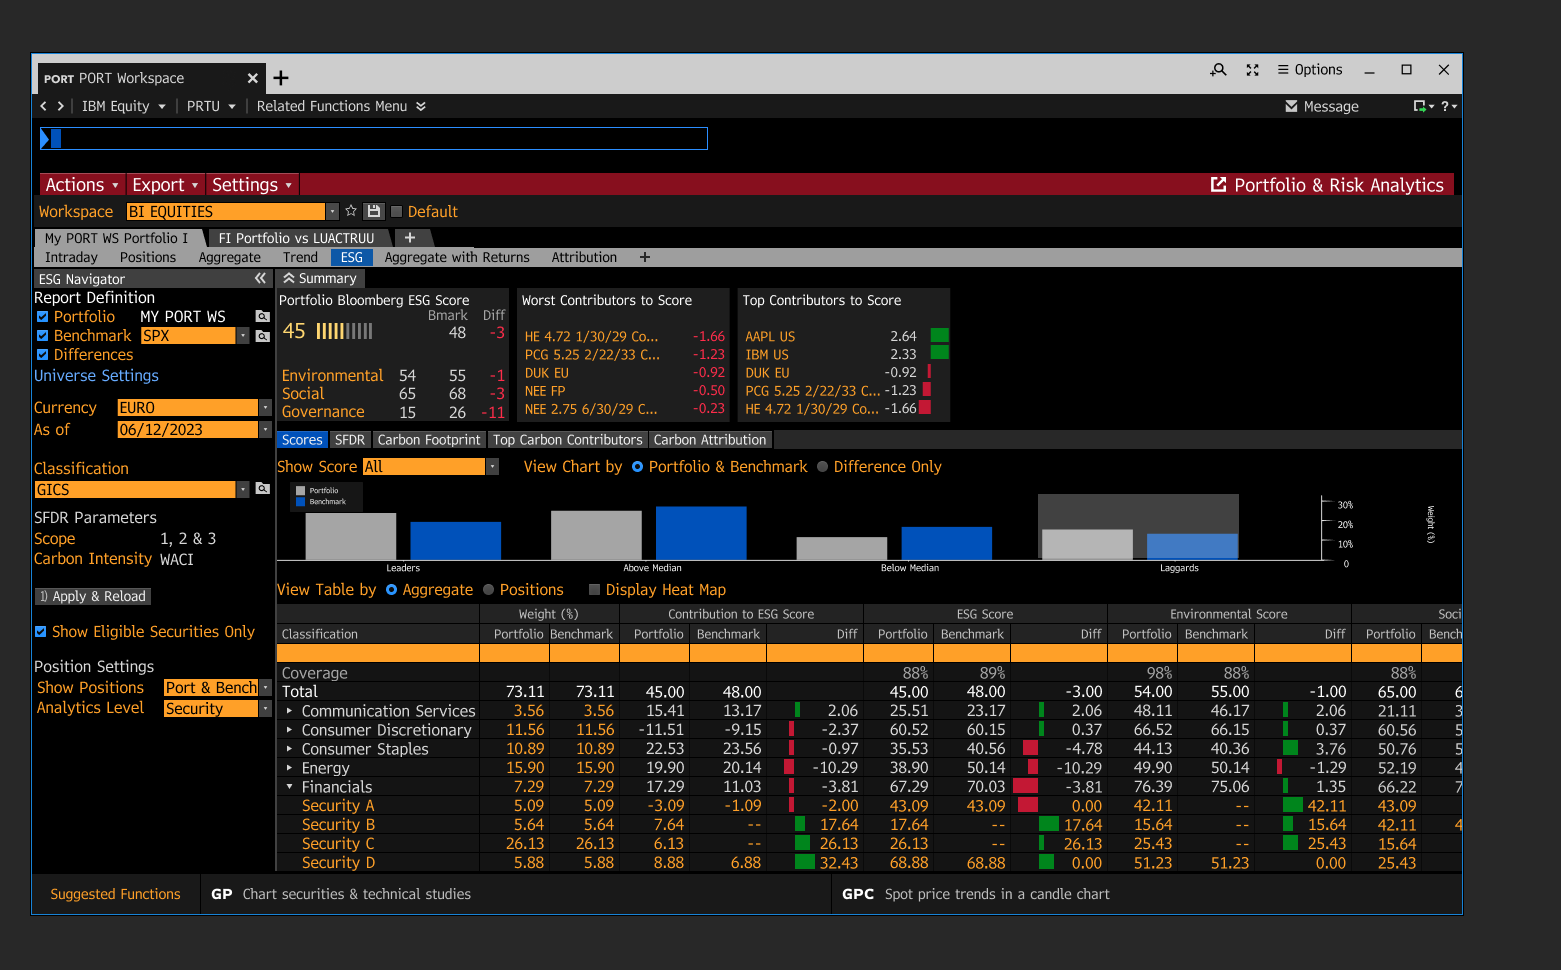
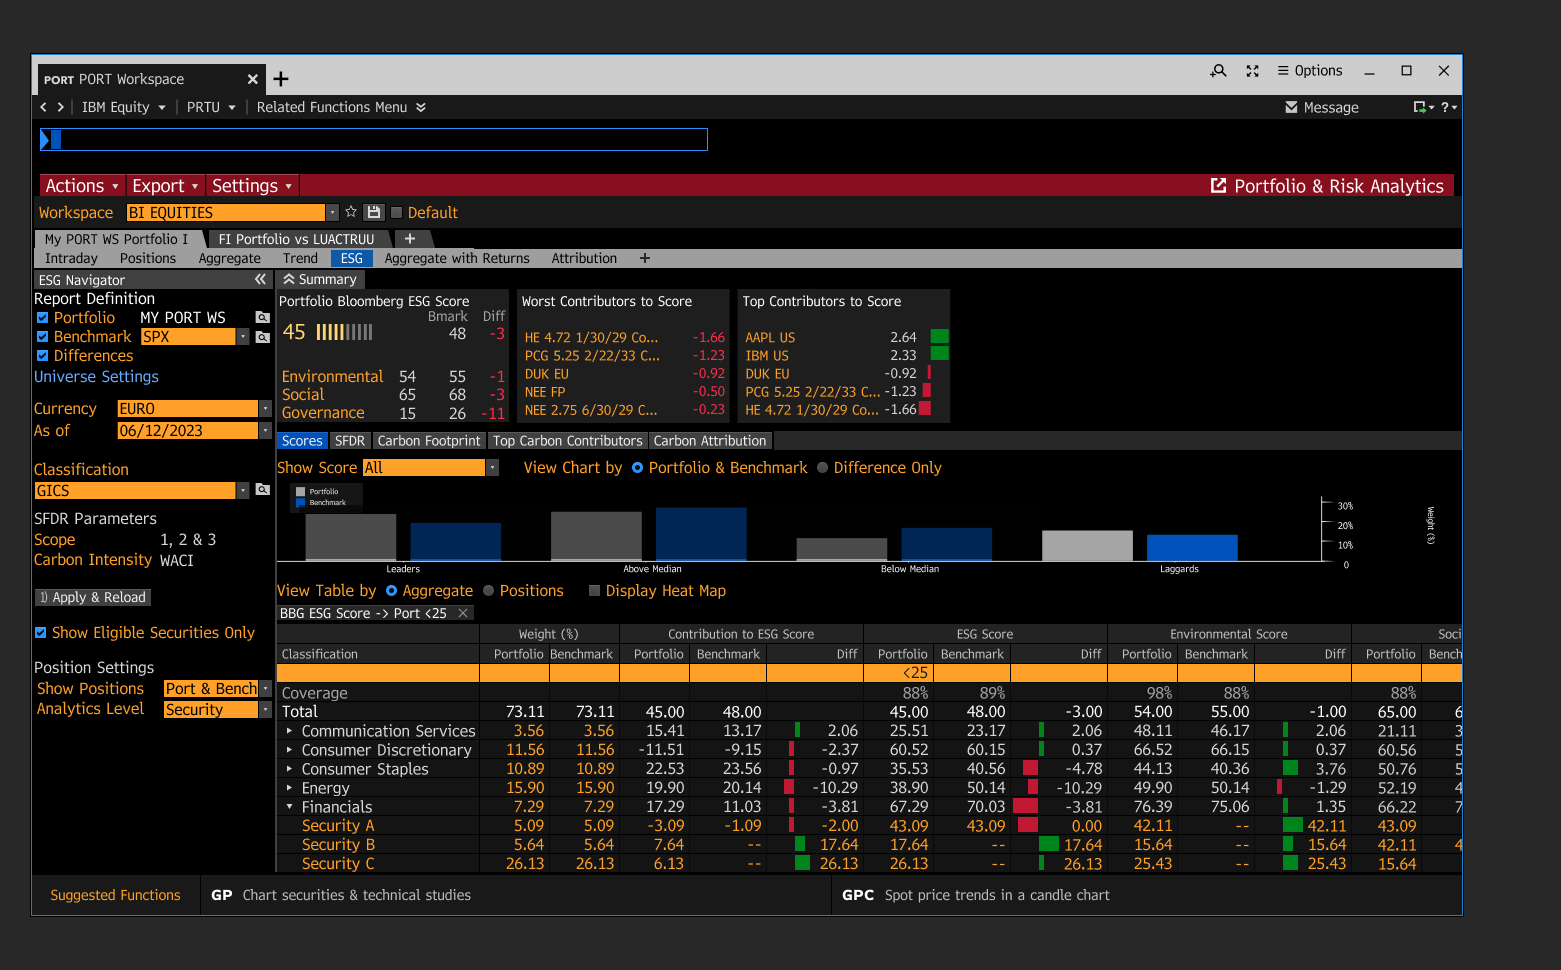
2. A Heat map version showcased the ESG health via the same categories (Leaders, Above median, Below Median, Laggards) with the intention for users to prioritize where to start their analysis.
After me and a second designer met with two proxy users, we learned that the visuals were too noisy and led to confusion in the interaction of the screen. Given where we were at with the development of this new screen within the Portfolio Analytics product, we shared these findings with the product manager and re-aligned on our MVP goals.
Primary Questions needed to be readdressed.
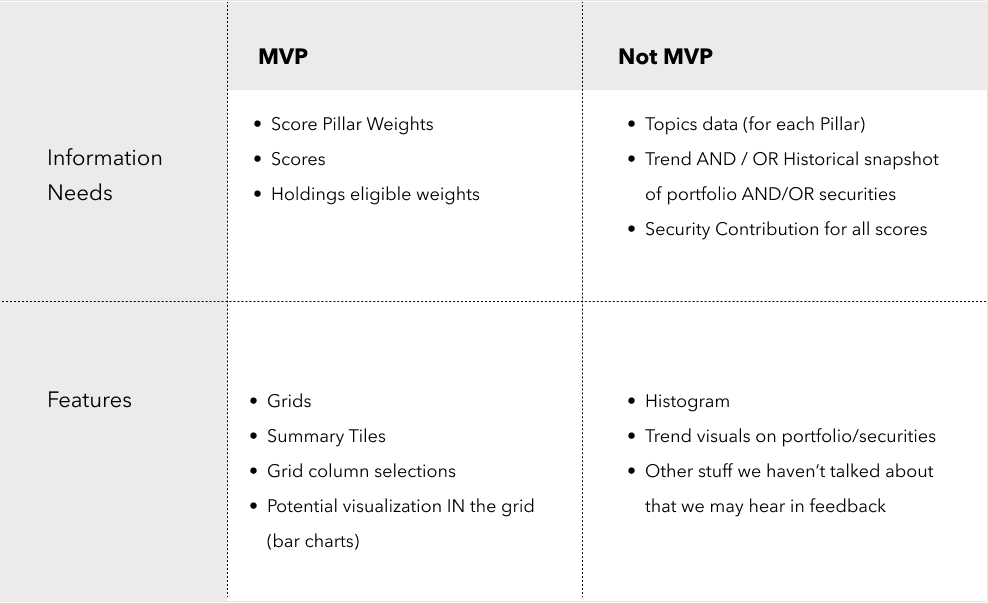
We clarified that we have the following key questions to address for MVP and clarified whether there were any other questions that should be considered for MVP.
This allowed us to re-focus on the most important information that we should show and helped map out a plan for future iterations.
DESIGN
I began the MVP design
Given many dialogues we were having with product, we wanted to confirm what the best way to dispose of the aggregate and holding level information to users.
Question I wanted to clarify:
Did a top down approach mean that we did not have to expose a tree view?
I introduced the idea of a drill-in from a top down view, so that users can have less noise and focus on the holdings within a sector or category that called their attention from the top-down approach.
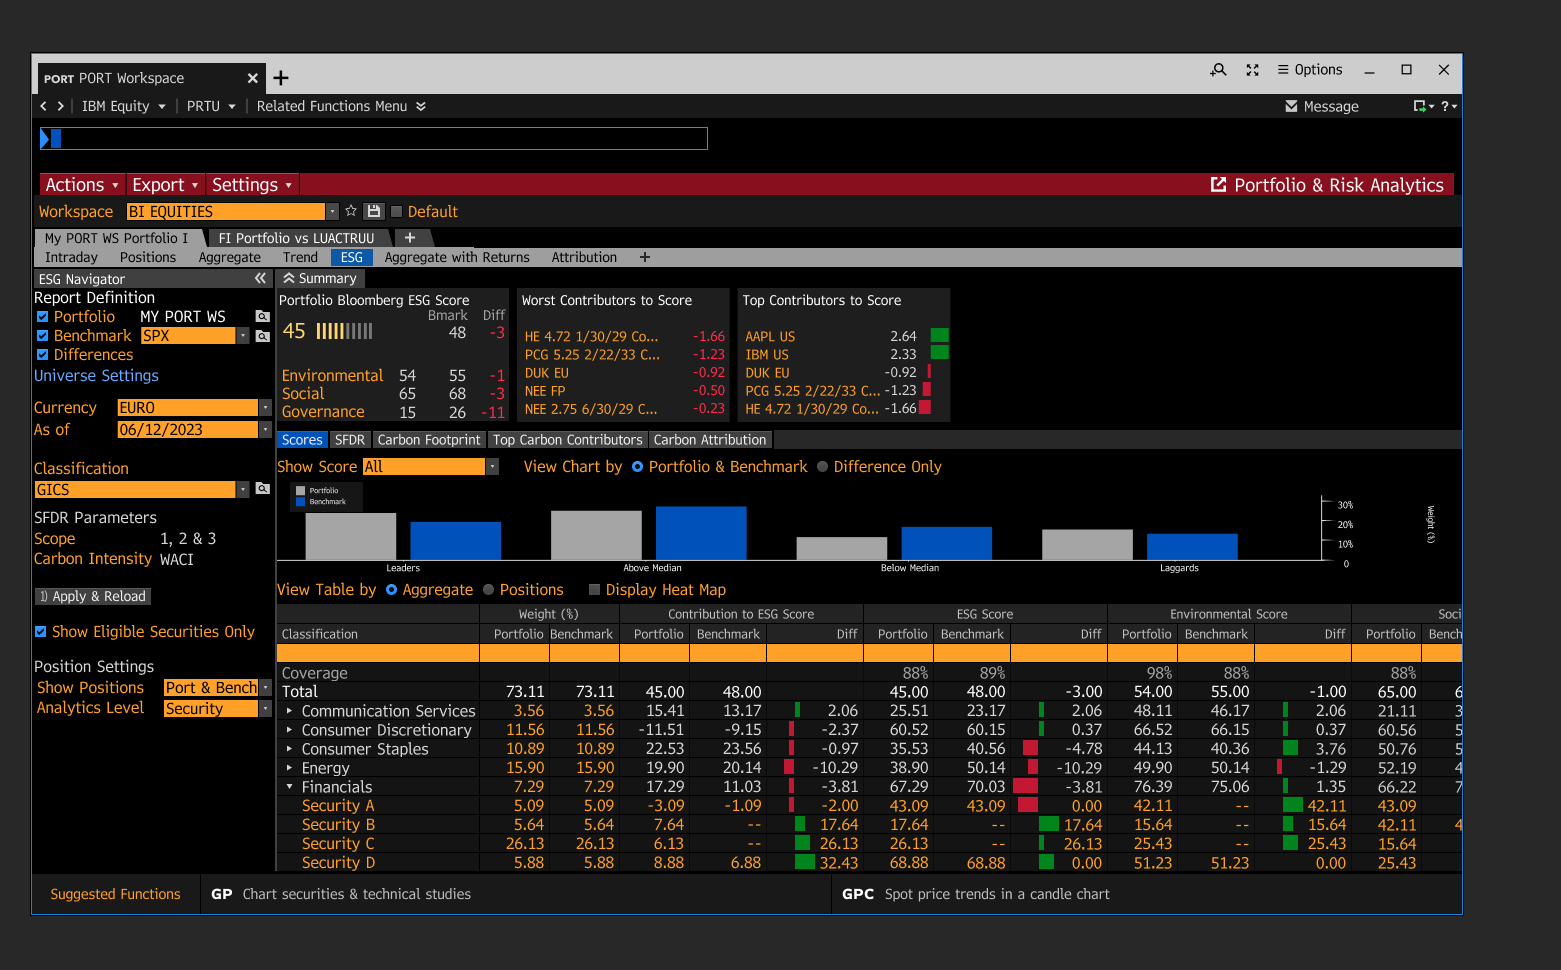
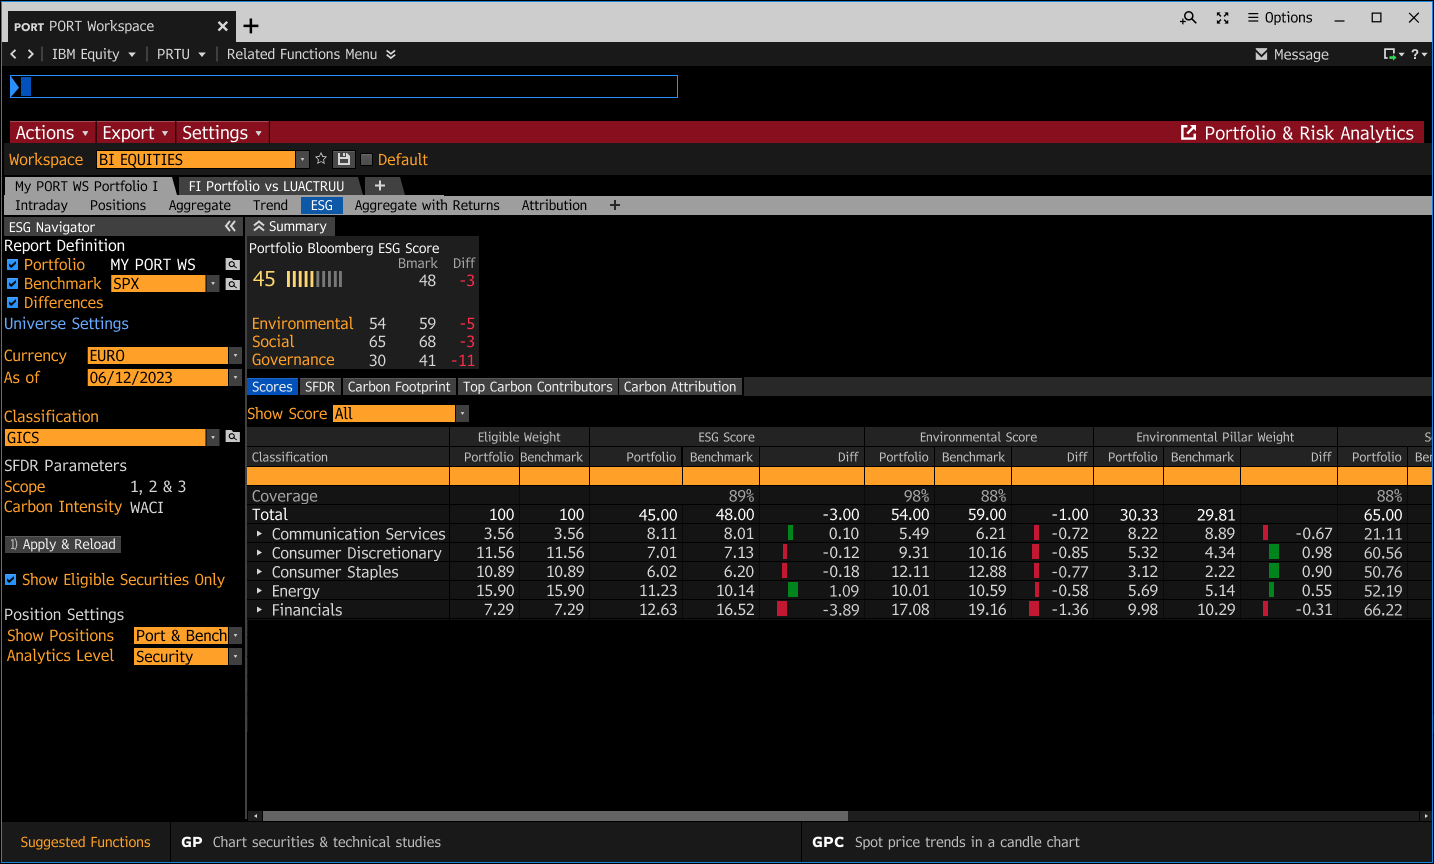
Tree View
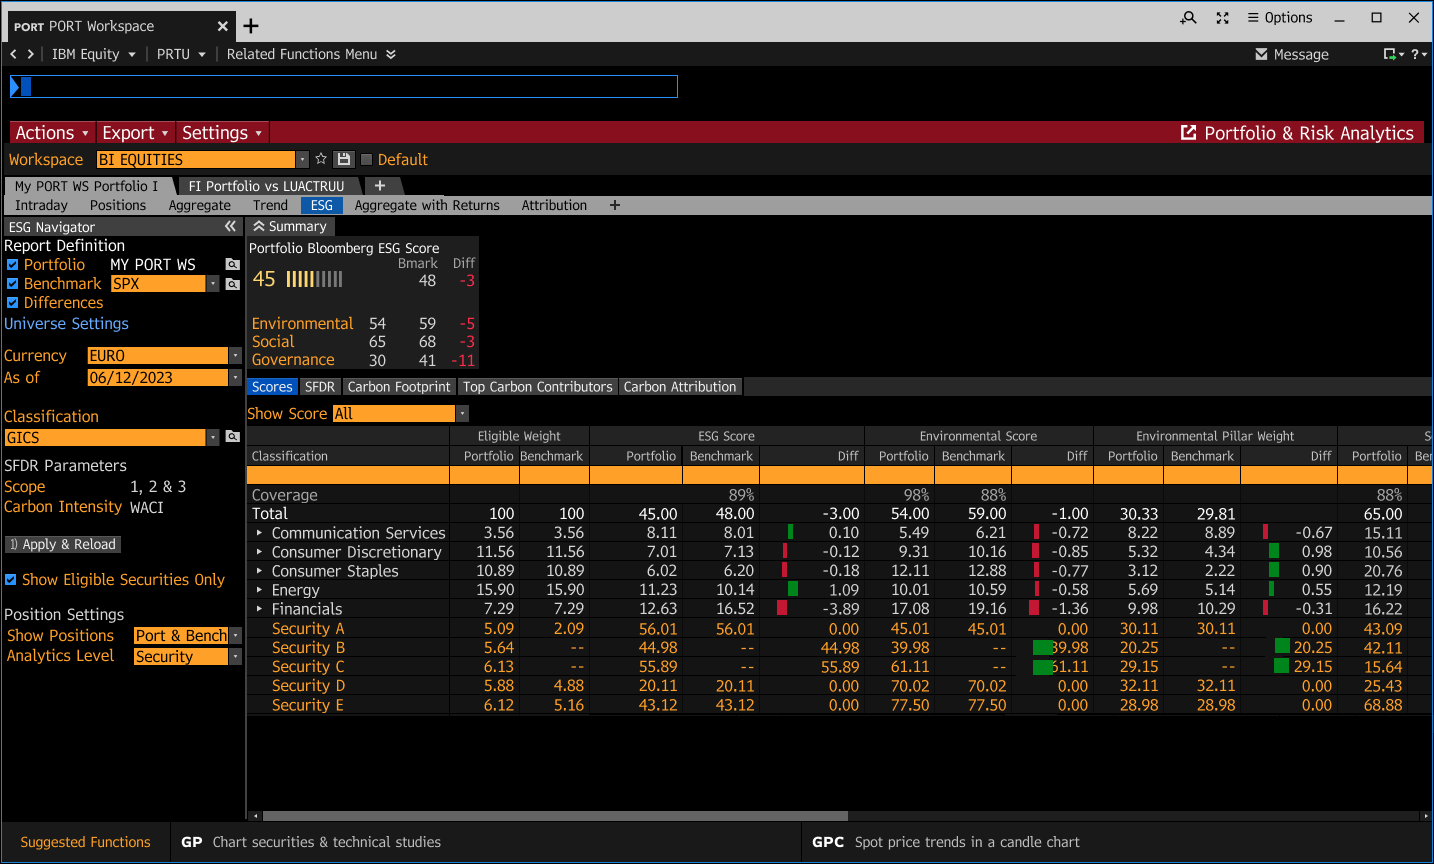
Drill-in View
We facilitated quick feedback sessions with real users to help us uncover the data they needed to see and how they needed to see it.
We spoke to three (3) users and learned that the drill-in option is not suitable given clients’ information needs.
They didn’t find the tree view “noisy” and preferred to have the aggregate and security ESG data at once to analyze both these subjects on-the-fly.
I aligned on the MVP requirements, information needs, and features with the Product team so that we could move forward in alignment.
DELIVERY & BUILD SUPPORT
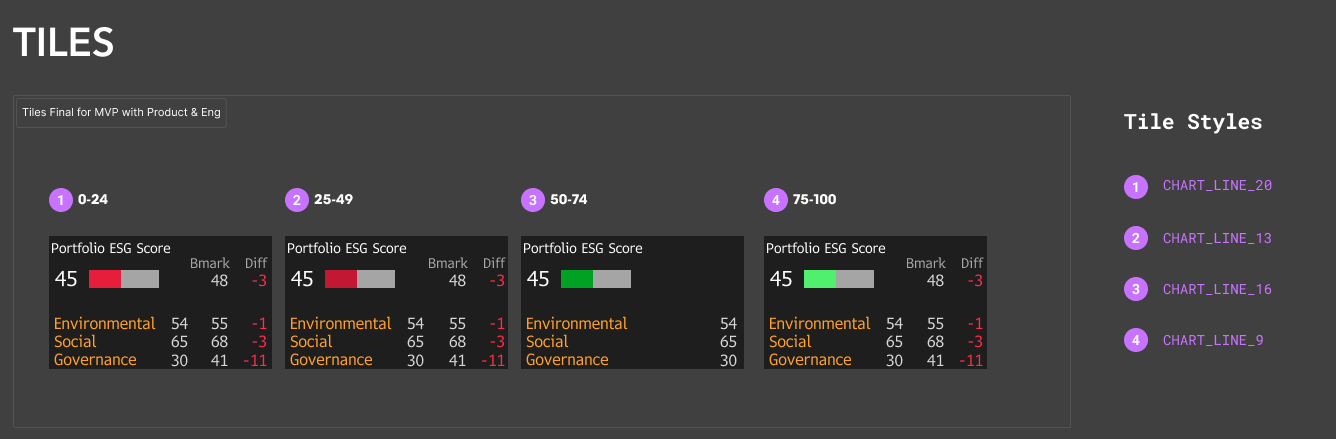
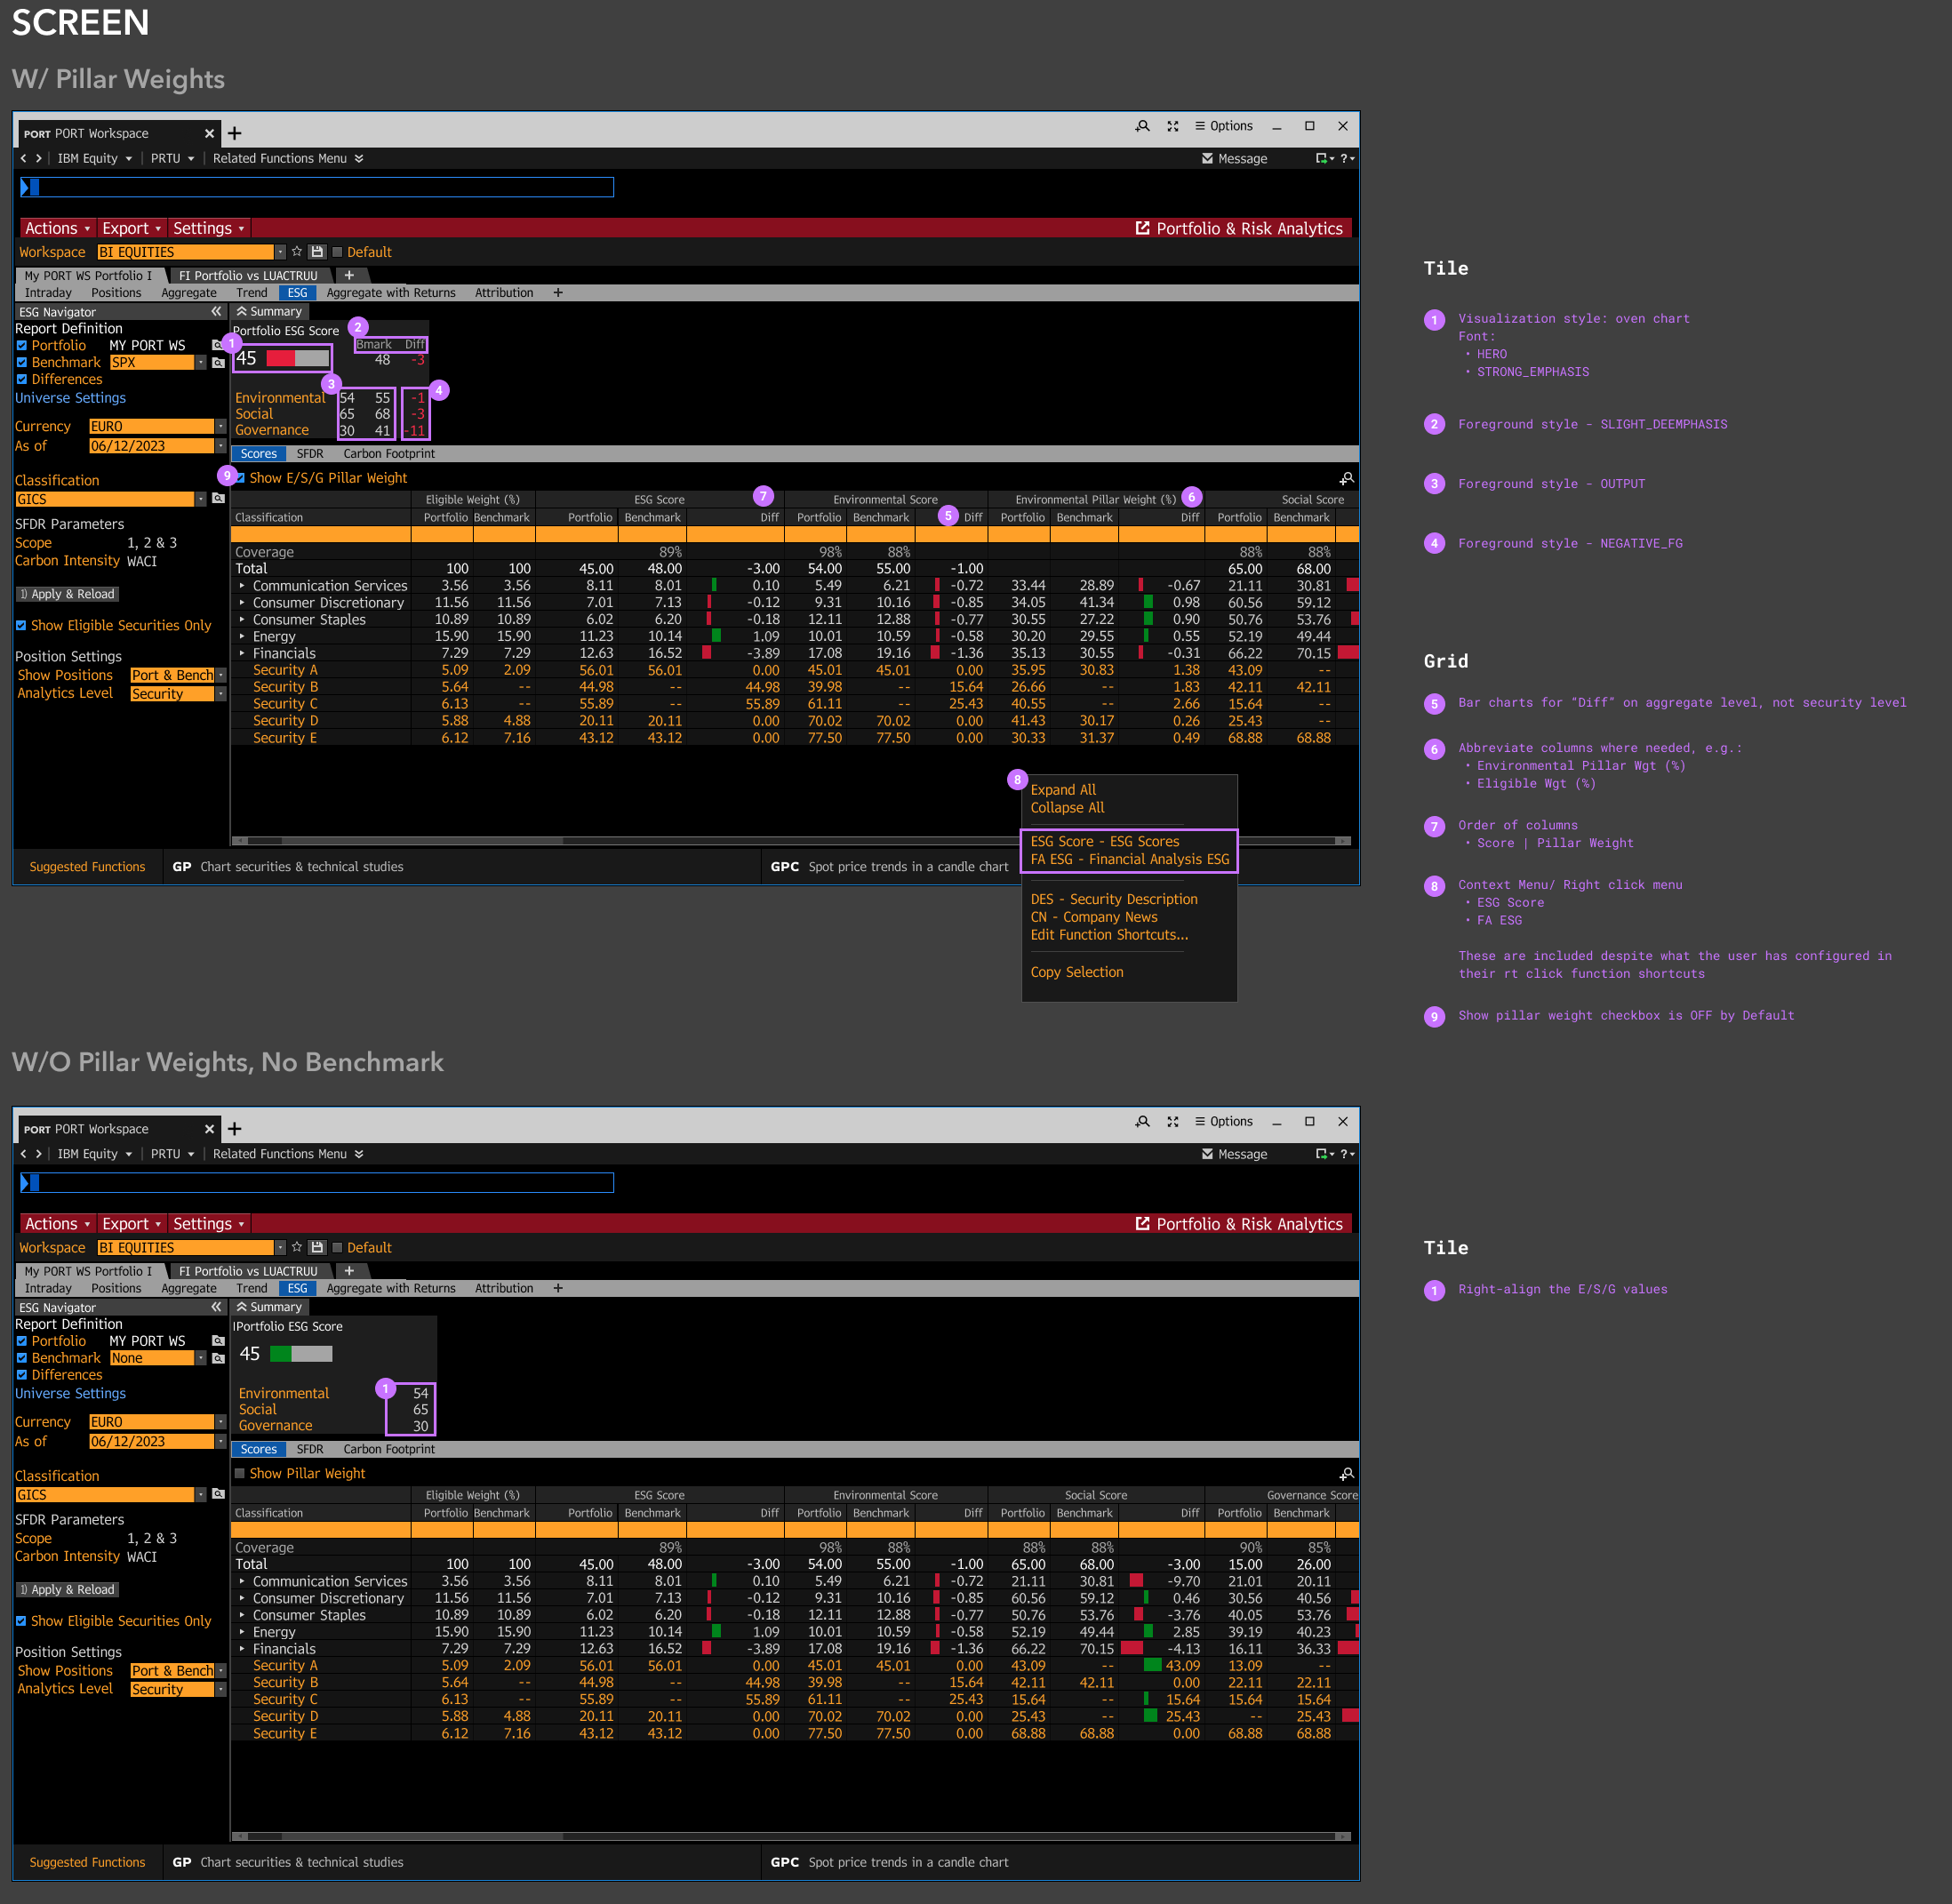
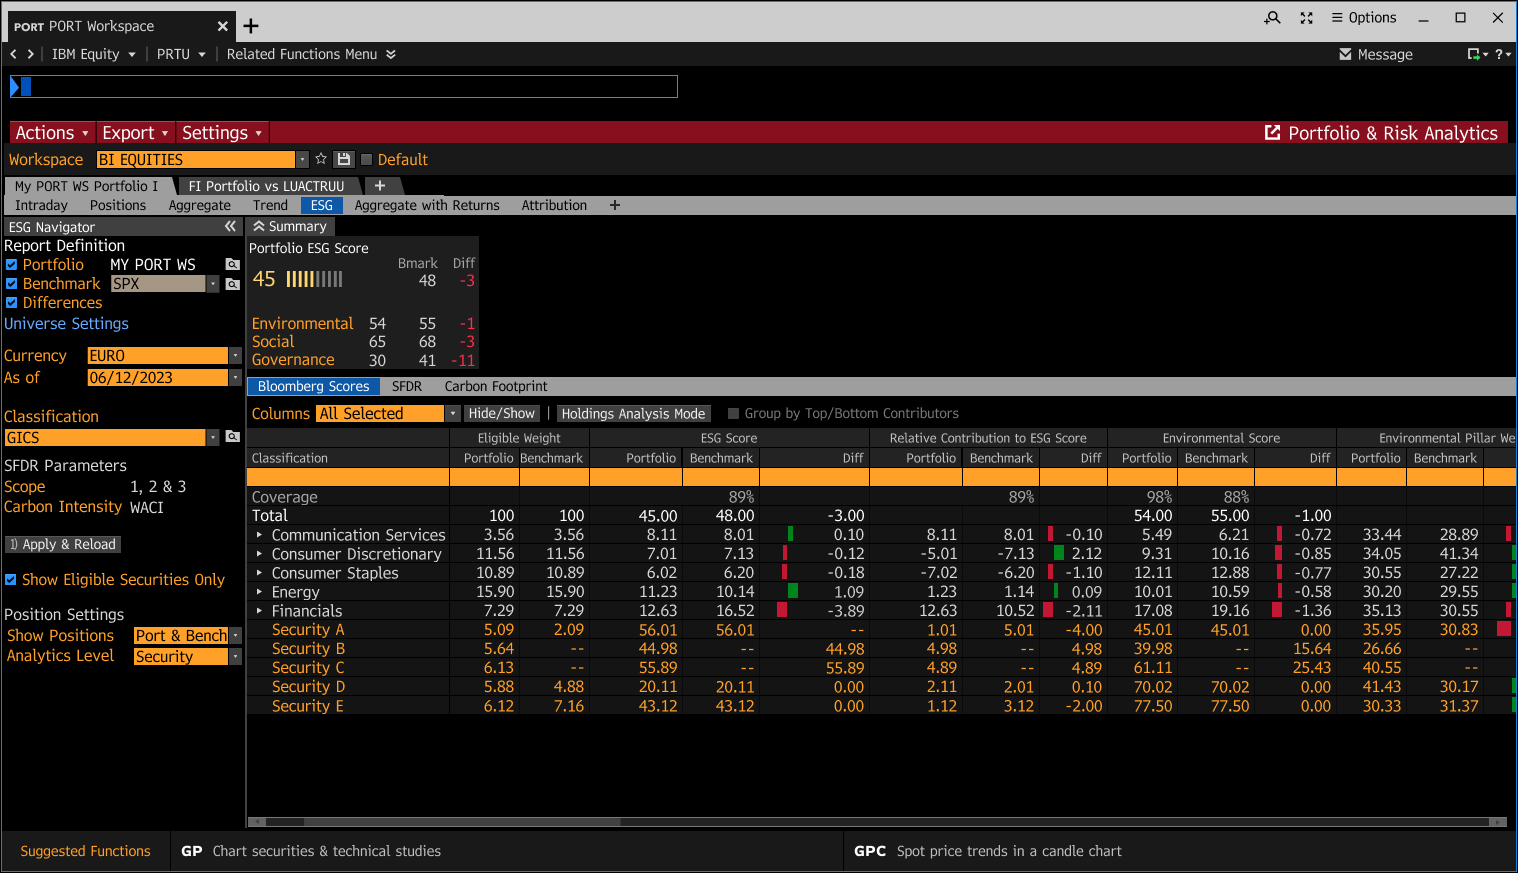
I finalized the final MVP Design
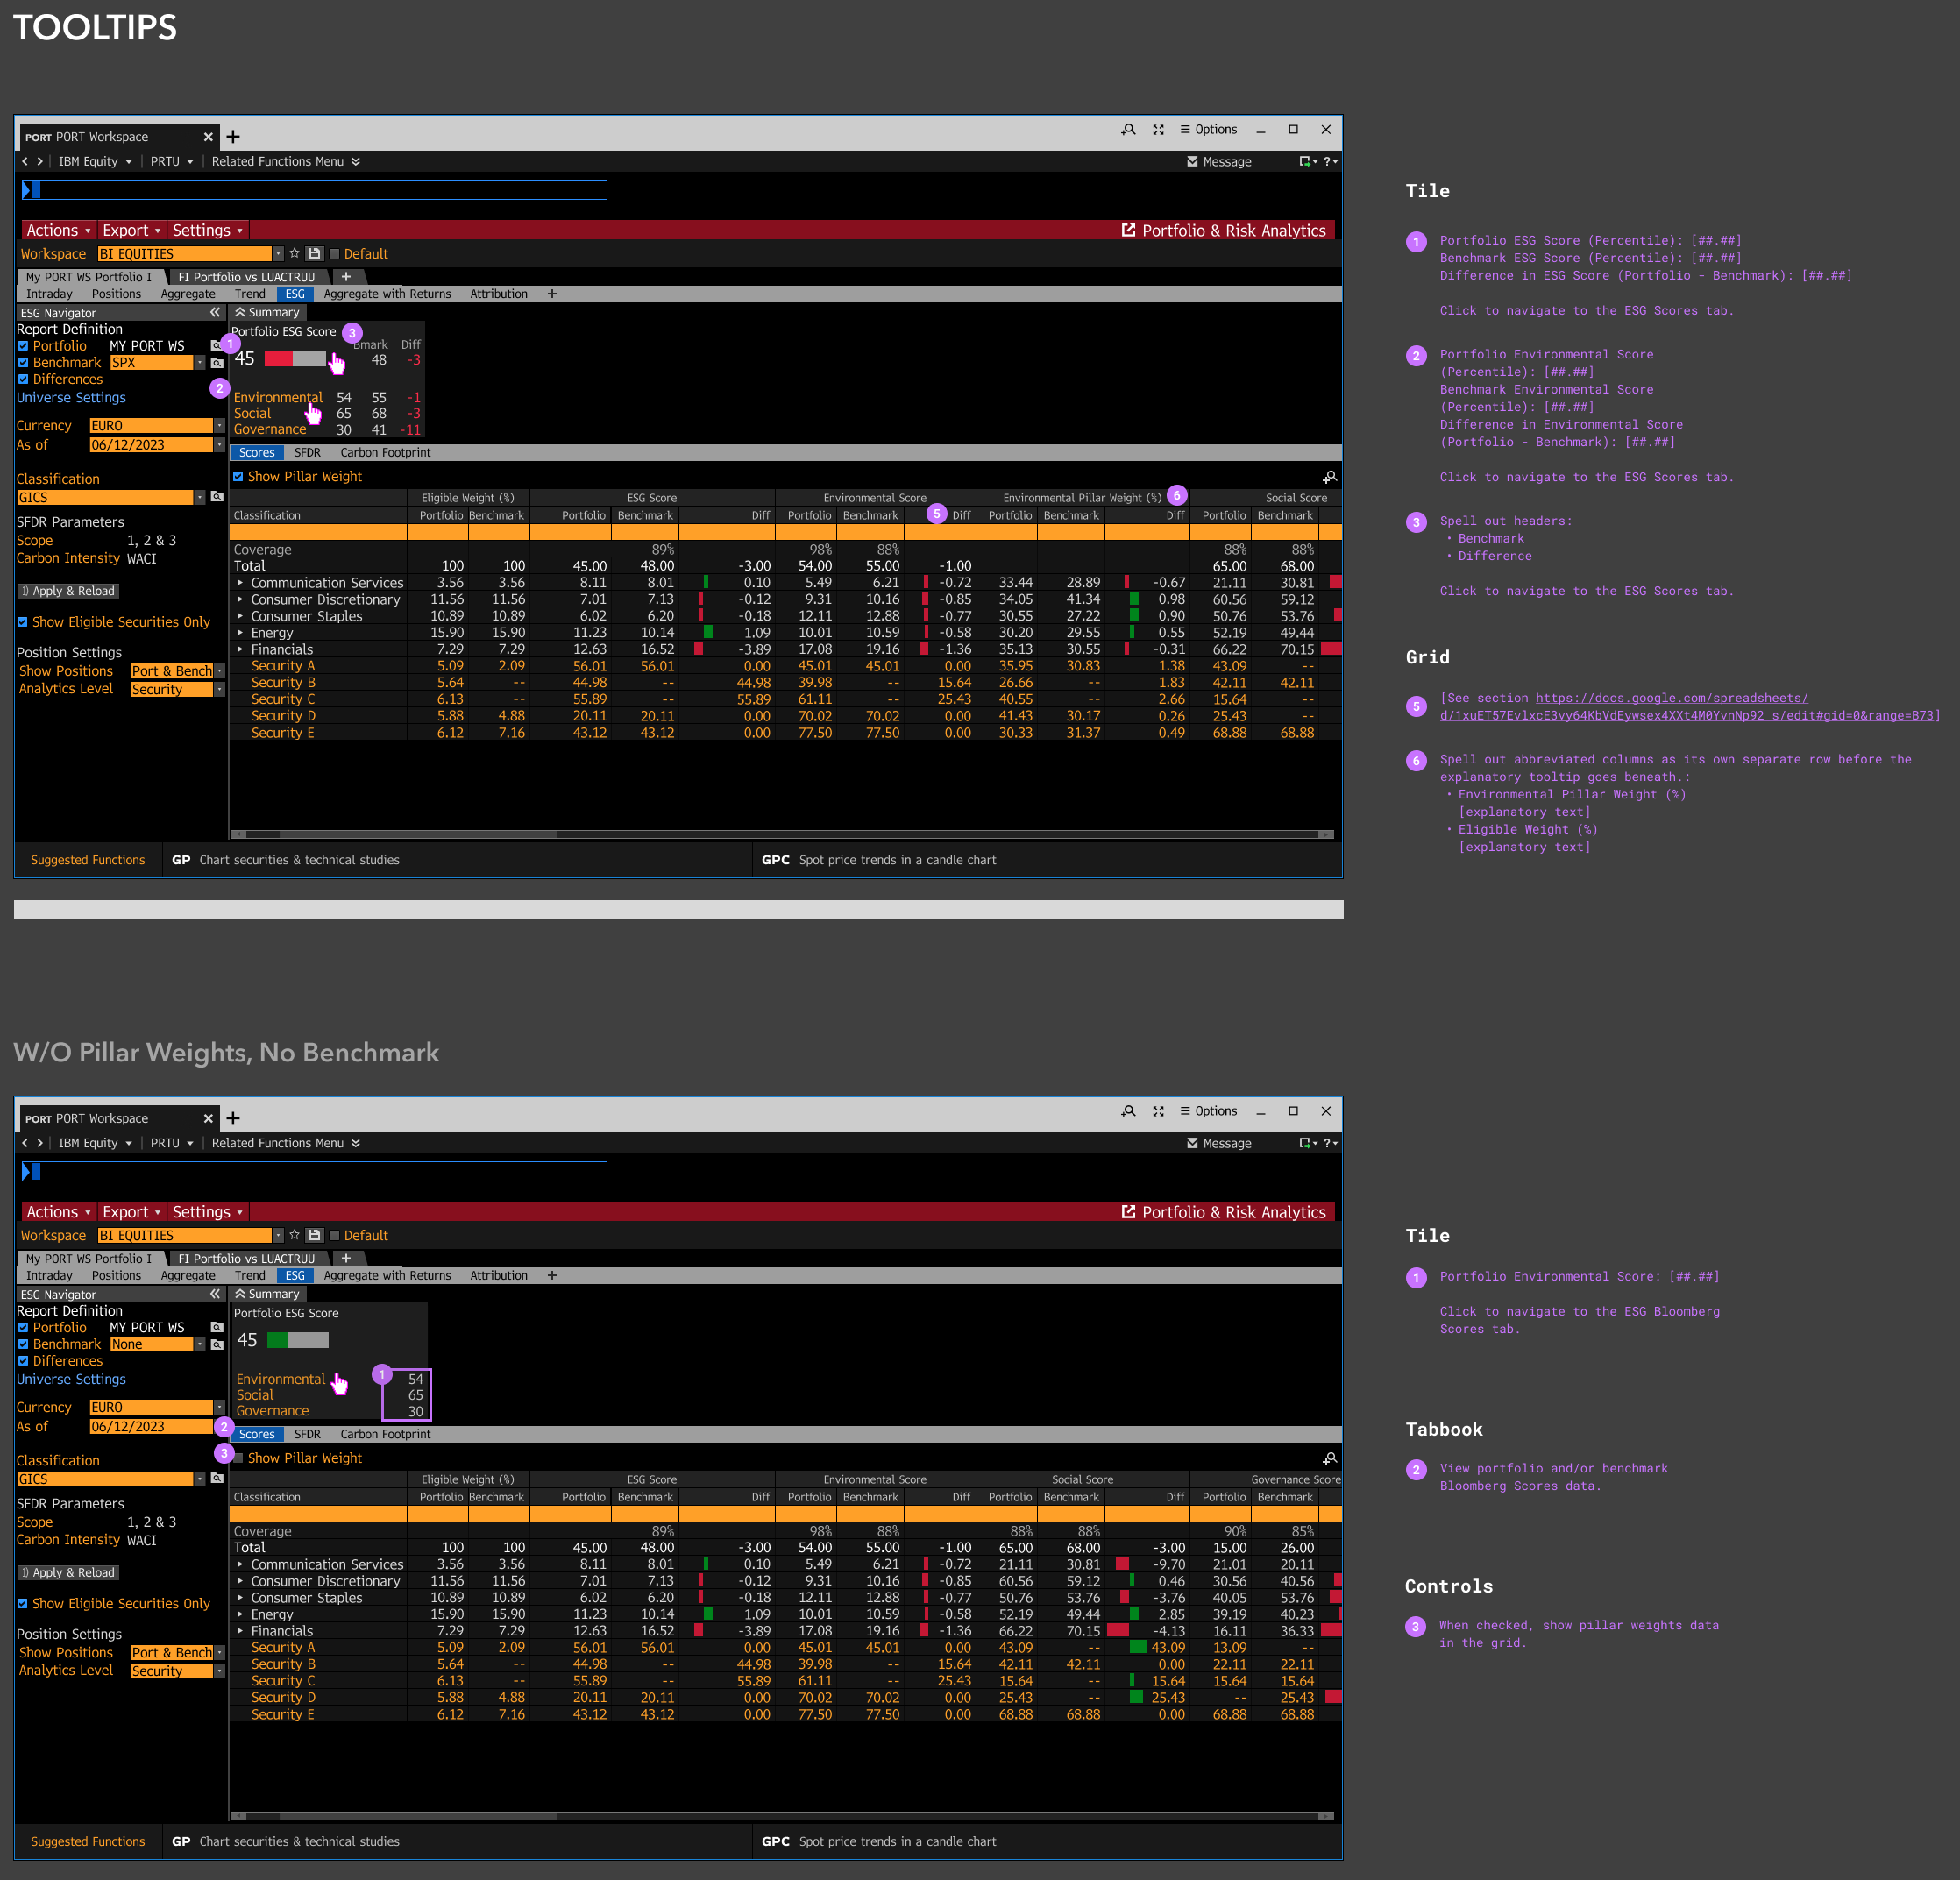
Specs and wireframes were provided to the dev team. I collaborated throughout the implementation process, ensuring that design elements were accurately translated into code with precise styles, spacing, and overall fidelity to the original design.
Summary of Design Impact
Post-MVP Discussions
In the midst of working on the MVP design, we began collectively discussing the following, given my product vision:
The need for users to compare their ESG data in portfolio against their benchmark and then pivoting to holdings (i.e. the comparison with benchmark, aggregate approach, no longer applies once they have an idea of where they stand).
How can we provide users more confidence in digesting score data? Instead of having them review and cross-check loads of data to come up with an insight on securities that are risky to keep?
We needed clarity on the following…
Is there a frequent use case of switching (on the fly) from an aggregate view to a bottom up view?
Are there client use cases where scores analysis does not equal other ESG analysis? I.e. some ESG is done top down, but Score is bottom up.
When a person needs to view their information with classifications, do they do so for all ESG needs (scores, SFDR, etc), or is it a mix-and-match? For example, I need to analyze carbon footprint by sector, but not in Scores.... because of....
Is there a contribution calculation we can provide to users so they don’t have to jump through hoops to understand what securities are risky?
How is negative contribution measured? Is Contribution of pillar (E,S,G separately) scores also important?
For the next iteration, I recommended that it would be ideal to get validation from clients directly.
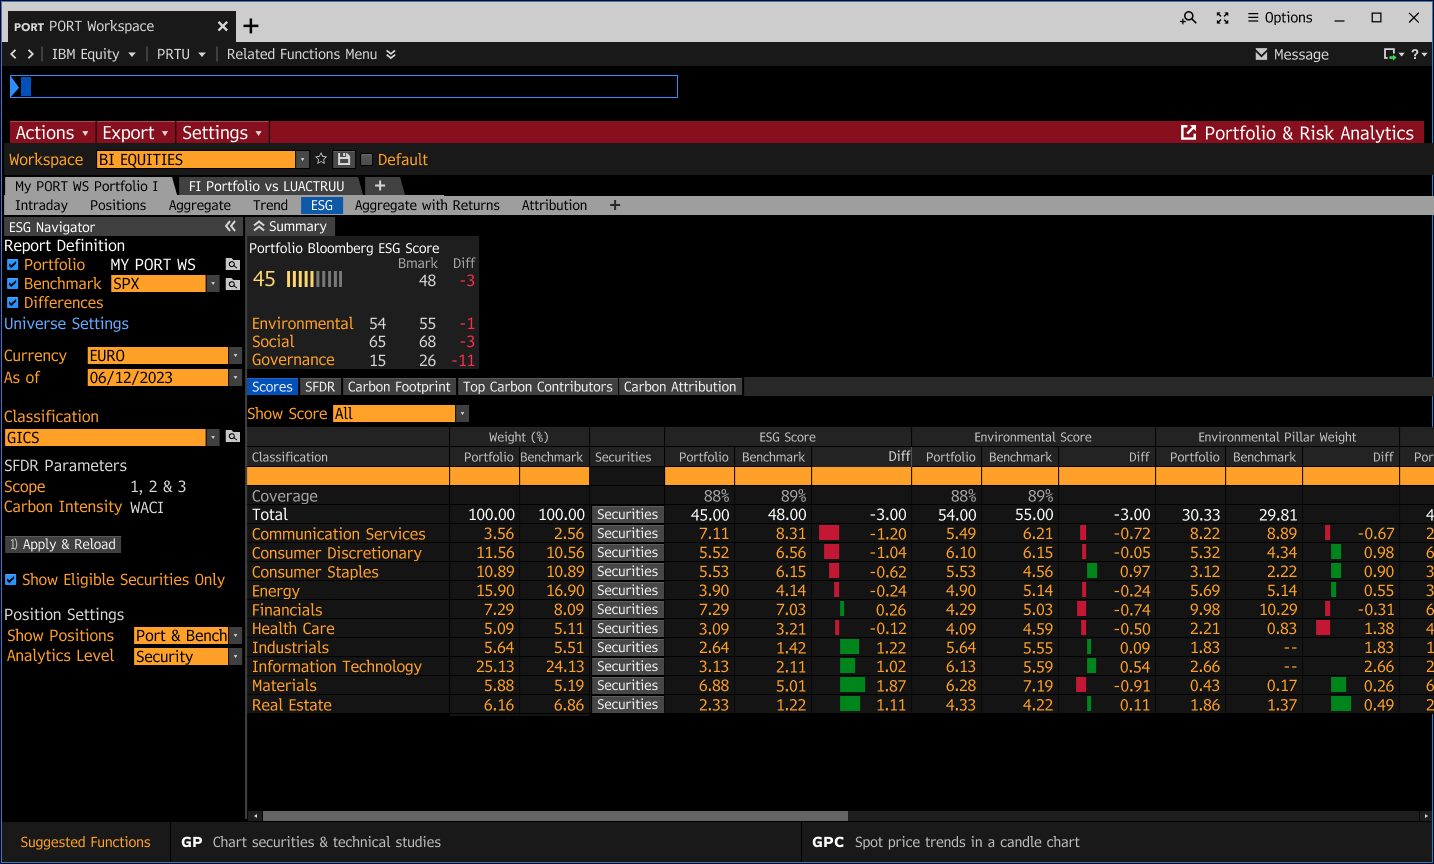
The PM however validated that there is a use case of switching from aggregate to bottom up, on the fly. So I began exploring designs for next iteration phase. The goal was to provide users the flexibility of seeing their holdings in classifications and holdings (top down to bottom up). These iterations were later passed on to my colleague given my team’s resource constraints.
My explorations
Given project allocations, my peers took over the rest of my explorations post the MVP release while I helped and consulted them with my knowledge on the topic, the product users, and regarding any questions that arose around the project history.
Continued explorations by peers
REFLECTIONS
What I learned. Skills used.
This was honestly a challenging project from the start because I had to quickly ramp up on a new domain I hadn’t any experience in. I not only ended up ramping up quickly given the lot of research I did on my own offline, but I became an important contributor to the product vision and features.
What I learned from this project was to follow to my gut instincts more, since I spent time designing concepts that the PM had been inclined on, but was not rooted in any of the grounded discussions we had.
Some of the skills I used and honed in on was stakeholder alignment and management, since I essentially became a liaison between the Portfolio Risk & Analytics and ESG product teams. My PM trusted me to lead this project without her close involvement, and I used good judgment to loop her in in the moments that it was important to.
All in all, this project was a fun experience because I got to learn a whole new domain (ESG) and despite it being fast-paced, we held a post-mortem to openly discuss what a more efficient collaboration would have looked like and learnings.